Transcription of Education at a Glance: OECD Indicators
1 Education at a glance : OECD Indicators is the authoritative source for information on the state of Education around the world. It provides data on the structure, finances and performance of Education systems in the 35 OECD countries and a number of partner countries. Chile Chile devoted the third largest share of public funds to Education among OECD countries in 2013, but its share of private spending on Education is also one of the largest. The employment prospects and earning premiums of tertiary-educated individuals in Chile are above average for OECD countries but only 21% of the population have completed tertiary Education , compared to the OECD average of 36%.
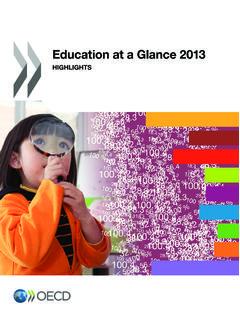
2 Teachers in Chile face comparatively low salaries and high workloads. Their statutory working time is around 30% more than the OECD average, and the student-teacher ratio in Chile is the second highest among OECD countries. Among OECD countries, Chile devotes the sixth largest share of GDP to early childhood Education . However, as enrolment rates at this level of Education have more than doubled in the last ten years, expenditure per student remains comparatively low. Figure 1. Public and private expenditure on educational institutions, as a percentage of GDP (2013) From public1 and private2 sources Chile - Country Note - Education at a glance 2016: OECD Indicators 2 OECD 2016 High-quality Education needs sustainable funding Among OECD countries, Chile devotes the third largest share of public funds to Education .
3 In 2013, Chile spent a total of of public resources on educational institutions from primary to tertiary level, which was well above the OECD average of Educational expenditure is also substantial relative to Chile s gross domestic product (GDP). The country spends a total of of its GDP on primary to tertiary Education , which was above the OECD average of (Figure 1). Private expenditure remains a significant source of funding for Education in Chile. At tertiary level, private spending constitutes 62% of all expenditure, more than double the OECD average of 30%. In addition, the large majority of this funding comes from private households.
4 Private funding also remains relatively high at primary, secondary and post-secondary non-tertiary level, at 21% of all expenditure, compared to the OECD average of 9%. However, Chile has been increasing the share of public expenditure relative to private resources, while this ratio remained stable among OECD countries. Between 2005 and 2013, public funding of Education at the primary, secondary and post-secondary non-tertiary levels rose by 8 percentage points from to 70% to 78%, while it fell by 1 percentage point (from 92% to 91%) on average among OECD countries. At tertiary level, the share of public expenditure more than doubled from 16% to 35% while on average it only increased from 70% to 71% among OECD countries.
5 Expenditure per student in Chile is increasing faster than on average across OECD countries at all levels of Education . At tertiary level, even though enrolment grew by 34% between 2008 and 2013, more than the average growth of 11% for OECD countries, expenditure increased even more over this period (41% compared to 17%). As a result expenditure per student rose by 5% over this period, similar to the OECD average. Tertiary Education has a strong impact in the labour market The level of tertiary attainment among 25-64 year-olds in Chile is one of the lowest of the OECD countries. In 2015, 21% of the population had completed tertiary Education , compared to the OECD average of 36%.
6 In comparison to Latin American countries with available data, Chile has a higher tertiary Education attainment rate than Brazil, where only 14% of the population has a tertiary degree, and slightly lower than Colombia, where the rate is 22%. If current patterns are maintained, 87% of young people in Chile are expected to enter tertiary Education in the future, well above the OECD average of 68%. However, only 12% of youths are expected to enter master s programmes, compared to the OECD average of 23%. The employment rates of all tertiary graduates in Chile are at the OECD average: 84% of tertiary-educated adults (aged 25-64) are employed in Chile, equalling the average across OECD countries.
7 In addition, individuals with a master s degree are much more likely to be employed than those with a bachelor s or short-cycle tertiary qualification. In 2015, 94% of master s graduates were employed in Chile, compared with 85% of bachelor s graduates and 81% of graduates from short-cycle tertiary programmes. Tertiary-educated individuals in Chile enjoy a very high earnings advantage they earn on average times the income of a person with upper secondary Education . Those with a master s, doctoral or equivalent degree earn over four times the income of those with upper secondary Education . This is the highest advantage of all OECD countries.
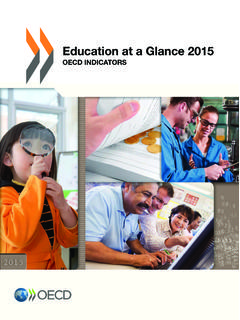
8 As in all countries and subnational entities that participated in the Survey of Adult Skills, a product of the OECD Programme for the International Assessment of Adult Competencies (PIAAC), the percentage of adults with high literacy proficiency in Chile is higher among tertiary -educated adults than among adults with only upper secondary Education . However, the percentage is small for both groups, and the difference between them is not very large (Figure 2). In Chile, less than 1% of adults with upper secondary Education as their highest level of attainment have high literacy proficiency (against an average of 7%) and only 5% of tertiary-educated adults have high literacy proficiency (average 21%).
9 Chile - Country Note - Education at a glance 2016: OECD Indicators OECD 2016 3 Figure 2. Percentage of adults scoring at literacy proficiency Level 4 or 5, by educational attainment (2012 or 2015) Survey of Adult Skills, 25-64 year-olds Salary, the school environment and workload all influence teachers decisions to enter and remain in the profession Teachers workloads in Chile are higher at each level of Education than the average for OECD countries. In 2014, teachers total statutory working time from pre-primary to upper secondary Education in Chile amounted to 2 006 hours per year, of which 1 146 hours was spent teaching. On average across OECD countries, teaching time ranged from 644 hours in upper secondary programmes to 1 005 hours in pre-primary.
10 Despite working the longest teaching hours in the OECD, Chilean teachers also have large classes at all levels of Education . In 2014, the average class size in Chile was among the highest of OECD countries, both in public and private institutions. In primary school the average class was 30 students, compared to an average of 21 in OECD countries. In secondary schools, the average class size was of 31 students, compared to 23 in OECD countries. In addition to a long schedule and a high student-teacher ratio, teachers in Chile are also paid substantially less than other workers with a tertiary Education . Teachers salaries are between 30% lower (for pre -primary teachers) and 23% lower (for upper secondary teachers) than those of tertiary-educated full-time full-year workers.