Transcription of ELECTRIC CIRCUITS LABORATORY MANUAL - …
1 ELECTRIC CIRCUITS LABORATORY MANUAL (ECE-235 LAB) GUIDE LINES FOR THE EXPERIMENTS AND REPORT PREPARATION 1. Preparation for the experiment: Before conducting the experiment, the student is required to have read the experiment background and procedure from the experiment MANUAL and studied the related theory. The lab instructor may, during the experiment, ask students questions pertaining to the procedure and theory. The lab instructor may give negative points to and even prevent an unprepared student from conducting the experiment. Tardy students may not be allowed to perform the experiment. 2. LABORATORY teams: The class will be divided in teams of three or four students. The composition of the teams (which students will team up) is left to the preference of the students, but the lab instructor makes the ultimate decision as to each team's composition.
2 Each lab experiment requires a report. The lab reports are due on the next lab meeting. The lab report for the final experiment is due a week after the final lab meeting. Each team submits one report per experiment (unless otherwise required). The grade of the report is given to all members of the team. Late reports are penalized by taking 5 points off per each day past the due date of the report. The other grade components of the experiments are given to the students individually. If a student misses or is dismissed from an experiment, the grade of that student shall be zero for that experiment. 3. Preparation of the report: The report must be produced electronically ( using MS-WORD). Tables showing data or results, as well as figures and graphs should be produced electronically and embedded in the main body ( using MATLAB or MS-Excel, MS-Visio).
3 Include captions and titles for figures, graphs and tables as well as numbers for equations. The preferred language style is the use of the present tense and third person. The report must contain the following sections: a) Cover page: Include number and title of the experiment, date the experiment was performed and the names of the team members. b) Objective: Give a short description of the purpose of the experiment. c) Theoretical background: Give a brief description of the relevant theory. d) The experimental procedure: Summarize what was done for each experiment procedure. Do not copy or repeat the procedure description from the lab MANUAL . Report the measurement and other experimental data. Tabulate measurements if necessary. Include table number and title over tables. (e) Analysis of experimental data: Analyze the data.
4 Compare with theoretical results. Produce graphs using MATLAB or MS-Excel and embed the graph figure into the main body of the report. Include figure number and caption. Label axis. Show units. Tables and graphs should appear inserted in the text close to the place they are first mentioned and in the same section. Add remarks and calculations on each procedure if necessary. f) Conclusions: Summarize the experiment and the results. Discuss the factual knowledge gained. INTRODUCTION TO ELECTRIC CIRCUITS LAB (ECE-235 LAB) Objectives: 1- To introduce the students to the basic electrical equipments in the lab. 2- To be able to deal with some of the frequently used instruments and equipment; like the digital multimeter and DC Power supply.
5 Introduction: DC Power Supply The DC power supply is used to generate either a constant voltage (CV) or a constant current (CC). That is, it may be used as either a DC voltage source or a DC current source. You will be using it primarily as a voltage source. Recall that DC is an acronym for direct current. The voltage produced by the power supply is controlled by the knob labeled voltage. The current is limited by adjusting the knob labeled current. As long as the circuit does not attempt to draw more current than the value set by the current knob, the voltage will remain constant. This is often a difficult concept for students to grasp. Current limiting allows the power supply to be set such that it will not generate more current than it is safe. This can be useful as a safety feature, preventing electrocution due to accidental contact with terminals.
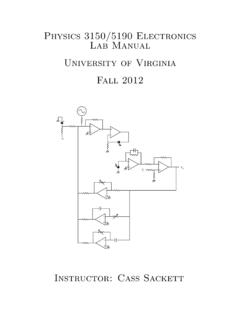
6 In addition, current limiting can prevent damage to equipment and parts which may be unable to handle excessive currents. Procedures: Part1: Voltage Measurement. 1- Turn on the DC Power supply. 2- Make sure that the current knob is little bit above the minimum value. 3- Adjust the voltage knob at V. 4- Measure the voltage value using the digital multimeter, and write down the measured value. 5- Find the percentage of error for the measured values. 6- State the reasons of the error. Part 2: Resistance Measurement Background on Graphite Resistance: The standard resistor color code is shown on the back of the door to the lab. Here is a quick synopsis: Most resistors have four colored bands. The first three bands indicate the nominal value of the resistor and the fourth band indicates the tolerance in value.
7 Figure 1: the value of the colors The tolerance band is typically either gold or silver. A gold tolerance band indicates that the measured value will be within 5% of the nominal value. A silver band indicates 10% tolerance. For example a resistor with color code brown-black-red-silver indicates a nominal value of 1 k. The first two bands (brown-black) produce the mantissa (10) and the third band (red) is the exponent of ten (). So the value is. Since the tolerance band is silver, we can expect the measured value of the resistor to be between 900 and 1100. Procedures: PART A: Resistance measurement. 1- Pick up and 75 . 2- Read the value of each resistance using the color method; show your steps in details. 3- Measure the value of each resistance using the digital multimeter.
8 4- Find the percentage of error for each resistance alone. PART B: Measuring the Resistance of Your Body 1. Holding one probe between the thumb and forefinger of each hand, measure the resistance of your body between your hands. Squeeze the probes tightly so that good contact is established. Record the value of your body's resistance. 2. Considering that a current of 100-200 mA through your heart will almost certainly kill you, how much voltage across your hands would be lethal? EXPERIMENT 1: ELECTRICAL MEASUREMENTS This experiment demonstrates the measurements of voltage, current, and resistance. The ohmmeter, the RLC-bridge, and two arrangements involving the voltmeter and the ammeter are presented for the measurement of ohmic resistance. I.
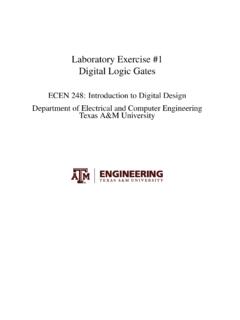
9 BACKGROUND Types of Electrical Measurements. Measurements performed on an ELECTRIC circuit include the circuit current, voltage, power, and resistance. The measurement of the current and voltage are basic as other quantities can be obtained such as power and resistance-power can be measured from the product of voltage and current and resistance can be measured from the voltage to current division (Ohm's Law). Electrical measurements are classified into two major types, each using and requiring different instrumentation: (a) DC measurements indicate the average value of a time-varying quantity. DC instruments are used only in CIRCUITS where the current is unipolar (dc), thus it has a non-zero average value. Figures A1 and A2 show two time-varying quantities that have non-zero average value.
10 The dotted line in each case shows the indication of a dc instrument measuring the quantity. Equation (1) is the formula used to calculate the average (also called dc) value of a periodic wave form. Note that, if the quantity is constant with time, its instantaneous value is also its average (dc) value. That is the case, for example, when a circuit is supplied by a battery. tx(t)Xaveragetx(t)Xaverage(1)(2) Fig. A Periodic wave forms and their average value (dc value). =TaveragedttxTX0)(1 (1) Where T is the period of the wave form of the measured quantity.