Transcription of Energy Efficient Reverse Osmosis Desalination Process
1 Abstract It is well known that water scarcity and global warming are the two most important concerns of the 21st century. Fresh water resources are limited and while Desalination can potentially provide unlimited supply of fresh water produced from infinite oceans, high Energy consumption and associated environmental impacts are major drawbacks. This paper presents a practical scheme for providing freshwater by utilizing hydrostatic pressure in conjunction with wave Energy . While in a typical seawater Reverse Osmosis plant, 3 to 10 kWh of electric Energy is required to produce one cubic meter of freshwater, in the proposed approach, since only the product water needs to be pumped to the surface the specific Energy consumption can be reduced to kWh.
2 Index Terms Desalination , hydrostatic pressure, Reverse Osmosis , submerged system. I. INTRODUCTION The idea of using renewable energies to operate Desalination plants with the aim of both meeting the future water demand and satisfying the CO2 emission reduction is becoming increasingly attractive. Solar powered Desalination plant in Egypt (Ahmad GE and Schmid J., 2002), Jordan (Gocht W et al, 1998) and Australia (Richards BS and Scha fer AI., 2002) as well as wind powered Reverse Osmosis plants in Croatia (Vujc ic R and Krneta M., 2000), Norway (Paulsen K, Hensel F., 2005; Paulsen K.)
3 , Hensel F., 2007) and Australia (Robinson R. et al, 1992) are few examples of such systems. In addition to renewable energies, hydrostatic pressure of the water has also been investigated as an option to improve the efficiency of Reverse Osmosis Desalination plants (Drude BC., 1967). In recent years water scarcity and global warming have led to intensification in research in this area by many researchers including (Reali M. et al, 1997; Colombo D. et al, 1999; Al Kharabsheh S., 2006; Piccari FM, Hardy A., 1999; Raether RJ., 1999; Grassi G et al, 2000). One of the major factors affecting the total cost of water production by any type of Desalination Process is the Energy cost.
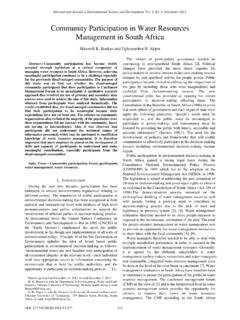
4 Typically in a Reverse Osmosis plant, 3 to 10 kWh of electric Energy is required to produce one cubic meter of freshwater from seawater. Fig. 1 shows the Process stages of a typical Reverse Osmosis plant, another major factor contributing to the total cost in a typical Reverse Osmosis Desalination plant are the fixed cost. Fixed cost depends on many parameters such as location of the plant and implemented technology. The major fragment of Energy Manuscript received June 5, 2012; revised June 30, 2012. Authors are with School of Engineering, Nazarbayev University, Kazakhstan, Astana, Australia (e-mail: consumed in a typical Reverse Osmosis plant is used to pressurize the feed water.)
5 Operating pressure depends on the degree of feed water salinity and varies between 15 to 30 bars for brackish water and 55 to 70 bars for seawater Desalination . As freshwater extracted from the feed, concentration of salt increases behind the membrane which could lead to fouling of the membranes and other components. Therefore the amount of freshwater that can be recovered is limited to as low as 25% to 45% for seawater and as high as 90% for brackish water (Charcosset C., 2009). At these percentages, a 25% increase in Energy cost would increase the cost of produced water by 11%. Unless another alternative solution is found that can reduce the Energy used in Desalination processes, the share of Desalination costs attributable to Energy will rise as Energy prices rise (Cooley H.)
6 Et al, 2006). Fig. 1. Reverse Osmosis Process stages Since cost of renewable Energy is generally independent of fossil fuel prices, the cost fluctuations due to Energy cost instabilities can be avoided if the system is operated with renewable Energy technologies. Furthermore the Energy required for pressuring feed water can be significantly reduced if deep-sea hydrostatic pressure is used. In a conventional seawater Reverse Osmosis plant with typical recovery ratio of around 25%, for each unit of freshwater four units of feed water has to be pressurized up to between 60~70 bars.
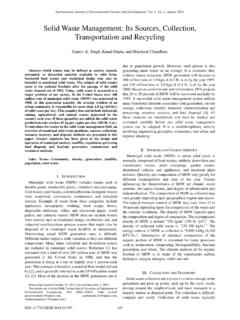
7 Even though it is possible to operate Reverse Osmosis units at higher recovery ratio, this will result in shorter membranes lifetime and increases overall operational cost. In contrast, in the proposed submerged Reverse Osmosis system, units are relocated at sufficient depth and potable water is produced using the natural hydrostatic pressure of the water. As a result only produced potable water has to be pumped up to the sea level which, if recovery ratio remains the same, in theory suggests reduction of shaft power to one fourth of what is currently needed. Fig. 2 shows the effectiveness of the proposed approach in terms of the elimination of condense brine rejection and operation sequence.
8 Energy Efficient Reverse Osmosis Desalination Process Reza Dashtpour and Sarim N. Al-Zubaidy International Journal of Environmental Science and Development, Vol. 3, No. 4, August 2012339 Fig. 2. Comparisons between the submerged Reverse Osmosis system current schemes II. IMPLEMENTATION REQUIREMENTS In order to evaluate the technical, social and economic benefits and limitations of the proposed scheme it is essential to select an area where the following conditions could be met: There is a need for fresh water for municipalities and agricultural proposes. Access to sufficient depth within the 10 kilometre from the cost.
9 Sufficient Wave Energy production capabilities at the location. Fig. 3 shows global map of suitable agricultural land while Fig. 4 highlights fresh water availability in the world, in addition wave power resources are presented in the Fig. 5. Fig. 3. World potential land use capabilities (FAO, 2012) Fig. 4. Global Fresh water availability UN (2012) Fig. 5. Global wave power resources (Global wave 2012) With reference to the above figures, several sites can be identified as the suitable candidates for closer evaluation of the project. West coast of the United States, South part of Oman, coasts of Australia, west coast of United Kingdom and east and west coast of Africa are some of these potentials.
10 Any of these sites possess the desirable requirement, however for the reasons listed earlier northern parts of Africa and in particular Morocco is suggested as the best candidate for testing and closer examination of the scheme where along with technical capabilities of the scheme socio-economic impact of the plant could also be tested. III. SYSTEM DESIGN CONCEPT In the proposed scheme potable water will be produced offshore at sufficient depth and then pumped to an onshore storage tank using submersible pumps where, if necessary, post treatment could take place prior to distribution (Fig. 2). The integrated system is suitable for the locations where deep water is available within few kilometers offshore.