Transcription of Enhancing Laboratory Efficiency through …
1 Enhancing Laboratory Efficiency through continuous Quality Improvement and LIMS Automation Michael Gallinaro, Michael Tucker, Dr. Christine Paszko, and Kimberly W. Skrzecz Corresponding author: Dr. Christine Paszko Accelerated Technology Laboratories, Inc. 496 Holly Grove School Road West End, NC 27376 Phone: 910-673-8188 Fax: 910-673-8166 E-mail: Enhancing Laboratory Efficiency at an Energy Utility through continuous Quality Improvement and LIMS Automation Introduction KeySpan Energy is the largest investor-owned electric generator in New York State and operates Long Island s electric system serving million customers.
2 KeySpan's Laboratory is responsible for a number of analyses including natural gas leak analyses, industrial hygiene, air quality, fuel oil quality, hazardous materials, wastewater discharge analysis, and permit compliance. In many situations, the turnaround time from sample collection through Laboratory analysis to final reporting is critical and Laboratory managers need to be able to make informed decisions based on test results. The Laboratory consists of two sites, the main site in Brooklyn, NY (Brooklyn Union Gas) and a second site (Long Island Lighting Company -LILCO) located in Glenwood, NY. As a result of an internal quality needs analysis, KeySpan determined that they needed a Laboratory information management system to increase productivity and enhance the quality management system already in place.
3 The Laboratory sought a LIMS that met their specific data management needs. Some of these requirements were a Windows-based system and compliance with NELAC (National Environmental Laboratory Accreditation Conference) and GALP (Good Automated Laboratory Practices). KeySpan selected Accelerated Technology Laboratories, Inc. because of their expertise and experience in environmental data management and Sample Master Pro LIMS to meet their specific data management needs. This paper will describe KeySpan's Laboratory sample flow, bottlenecks, the implementation of the Laboratory information management system and the resulting automation improvements.
4 Data Management Needs KeySpan Energy performed an internal quality needs analysis in order to evaluate their automation needs. The Quality Group performing the analysis was composed of a quality engineer, Laboratory managers and engineers. The group s mission was three-fold: 1) to focus on the Laboratory s sample analysis process to determine ways in which report turn-around times could be reduced, 2) the enhancement of data quality ( decrease transcription errors); and 3) the implementation of processes to accelerate the automated delivery of validated and approved results. The in-depth analysis was critical for the Laboratory managers in understanding the Laboratory operations and functions at a very detailed level.
5 The first step in the quality needs analysis was to outline the current sample flow through the Laboratory along with its data management and final reporting of results. A series of customized queries were created to measure user defined specific process points in the sample flow analysis. These queries were then analyzed for information on turnaround times during the various stages of sample analyses, they provided a report with time-stamps for each section from sample login, to analysis, to final reporting. KeySpan learned from the data analysis that the greatest loss of time occurred between sample login and result entry.
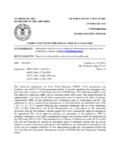
6 The time lapse was about days, out of , on average for a period of 6 months. Further analysis demonstrated that there was no direct correlation between the number of samples analyzed and turnaround time. In referencing this data, the team focused on the root causes of the poor turnaround time occurring between sample login and result entry by using proven quality tools such as brainstorming, cause and effect diagrams depicted in (Figure 1), and interrelationship diagrams in combination with the reports of turnaround times for each section in the Laboratory . The activities allowed the Quality Group to generate numerous solutions.
7 Figure 1 Cause and Effect Analysis of Laboratory Bottlenecks The above cause and effect diagram, otherwise known as a fishbone diagram, allowed the KeySpan Quality Team to systematically identify and display all the possible causes related to the bottleneck in the turnaround time process. The four main categories identified included; machinery/equipment, people, methods and materials. Examples include the need for up-to date training on the instrumentation and associated software and LIMS (as there were new analysts in the Laboratory that required training), ability to perform the same or greater analysis with fewer resources, and interrupting telephone calls to the Laboratory requesting test results, as they are trying to perform the analyses.
8 These are just a few of the examples of what the fishbone diagram revealed. Solutions to these issues included, providing training to the chemists on the instrumentation and LIMS. Performing more analyses with fewer resources was addressed with the LIMS, instrument integration, and auto-reporting features. Laboratory personnel were shielded from multiple calls requesting test results by establishing accounts for remote users to retrieve the sample status and test results in the LIMS by using the LIMS Explorer via the web. The results of this root cause analysis, as well as the automation enhancements post acquisition are classified in Table 1.
9 It takes days onaverage to complete step 1through step 2 MATERIALSMETHODSPEOPLEMACHINERY / EQUIPMENTNot informing DBA of new tests in the systemAnalyst not proactiveAnalyst not accountableBreaking continuityLack of KnowledgeNo rewardsNo penaltiesTelephone callsNo systemNot enough information on routing sheetsNo schedule for ordering materialsNo system or procedure in placeSuppliersLack of requirementsLab never specified requirementsMissing routing sheetsMis-filedNot printed outComputer problemsTrainingRepeat analysisMistakesLack of batchingInaccurate proceduresLack of contingenciesInaccurate chain of custodiesLack of informationLogin delaysTurnaround benchmarkRush samplesLack of schedulingLack of continuityLack of manpowerLack of schedulingBudgetInstrument down timeComputer issuesLack of trainingLack of cross trainingLack of timeLack of AnalystsBudgetUsing past performance as acceptableManagement & non-analyst not proactive Table 1.
10 Results of the Root Cause Analysis Performed at the Laboratory Causes for Bottlenecks Target Areas for Improvement Resolutions 1) Rush Samples 2) Improper Chain of Custody Internal Process Control Review - Implemented bar-coded labels in LIMS - Provide proper training to all end users - Capability to track specialized chains of custodies in LIMS 1) Outside Laboratories Turnaround Time Automation Enhancements & Vendor Partnerships - Automatic importing & exporting of results from contract laboratories - Audits suppliers practices - Required copies of their certifications - Provide them with required information - Review proficiency test results 1) Lack of Cross-Training (instrumentation, LIMS, methods, etc.