Transcription of ENSO: Recent Evolution, Current Status and Predictions
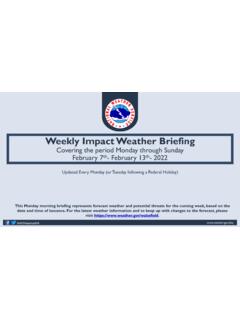
1 ENSO: Recent Evolution, Current Status and Predictions Update prepared by: Climate Prediction Center / NCEP. 5 February 2018. Outline Summary Recent Evolution and Current Conditions Oceanic Ni o Index (ONI). Pacific SST Outlook Seasonal Precipitation and Temperature Outlooks Summary Summary ENSO Alert System Status : La Ni a Advisory La Ni a conditions are present.*. Equatorial sea surface temperatures (SSTs) are below average across the central and eastern Pacific Ocean. La Ni a is likely (~85-95%) through Northern Hemisphere winter, with a transition to ENSO-neutral expected during the spring.
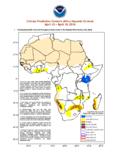
2 *. * Note: These statements are updated once a month (2nd Thursday of each month) in association with the ENSO Diagnostics Discussion, which can be found by clicking here. Recent Evolution of Equatorial Pacific SST. Departures (oC). During January and February 2017, above-average SSTs expanded in the eastern Pacific Ocean. From mid April to July 2017, near-to- above average SSTs spanned most of the equatorial Pacific. During August 2017, above-average SSTs dissipated east of the date line. Since September 2017, negative SST. anomalies have generally persisted in the central and eastern equatorial Pacific.
3 Ni o Region SST. Departures (oC) Recent Evolution The latest weekly SST. departures are: Ni o 4 C. Ni o C. Ni o 3 C. Ni o 1+2 C. SST Departures (oC) in the Tropical Pacific During the Last Four Weeks During the last four weeks, equatorial SSTs were below average across the central and eastern Pacific Ocean, and above average in the western Pacific. 30. 26. Global SST Departures (oC) During the Last Four Weeks During the last four weeks, equatorial SSTs were above average in the western Pacific and Atlantic Oceans. SSTs were below average in the central and eastern Pacific Ocean and the western Indian Ocean.
4 30. 26. weekly SST Departures during the Last Four Weeks During the last four weeks, below-average SSTs have persisted across the central and eastern Pacific Ocean. Change in weekly SST Departures over the Last Four Weeks During the last four weeks, localized changes were observed in equatorial SST. anomalies across the central and eastern Pacific. Upper-Ocean Conditions in the Equatorial Pacific The basin-wide equatorial upper ocean (0-300 m). heat content is greatest prior to and during the early stages of a Pacific warm (El Ni o) episode (compare top 2 panels), and least prior to and during the early stages of a cold (La Ni a).
5 Episode. The slope of the oceanic thermocline is least (greatest) during warm (cold) episodes. Recent values of the upper-ocean heat anomalies (below average) and thermocline slope index (above average) reflect La Ni a conditions. The monthly thermocline slope index represents the difference in anomalous depth of the 20 C isotherm between the western Pacific (160 E-150 W) and the eastern Pacific (90 -140 W). Central and Eastern Pacific Upper-Ocean (0-300 m). weekly Average Temperature Anomalies Positive subsurface temperature anomalies with large fluctuations in amplitude were present from mid-January through mid-July 2017.
6 Significant, negative anomalies lasted from August to December 2017, and returned to average values during mid January 2018. Recently, subsurface temperatures were weakly negative. Sub-Surface Temperature Departures in the Equatorial Pacific In the last two months, negative subsurface temperature anomalies have weakened across the central and eastern Pacific Ocean. This figure cannot be updated at this time. Most Recent pentad analysis Positive anomalies have expanded eastward to 110 W and weakened at depth. Negative anomalies now mostly exist close to the surface between 170 W-90 W.
7 Tropical OLR and Wind Anomalies During the Last 30 Days Negative OLR anomalies (enhanced convection and precipitation) were evident over Indonesia, Malaysia, SE Asia, the Philippines, and northern Australia. Positive OLR anomalies (reduced convection and precipitation) were present over the central Pacific Ocean. Low-level (850-hPa) winds were anomalous easterly over the western and central tropical Pacific Ocean. Upper-level (200-hPa) winds were anomalous westerly over most of the tropical Pacific Ocean. Intraseasonal Variability Intraseasonal variability in the atmosphere (wind and pressure), which is often related to the Madden-Julian Oscillation (MJO), can significantly impact surface and subsurface conditions across the Pacific Ocean.
8 Related to this activity: Significant weakening of the low-level easterly winds usually initiates an eastward- propagating oceanic Kelvin wave. weekly Heat Content Evolution in the Equatorial Pacific From February 2017 through May 2017, positive subsurface temperature anomalies persisted in the western and eastern Pacific Ocean. During August 2017, an upwelling Kelvin wave resulted in below-average sub-surface temperatures across the east-central and eastern equatorial Pacific. From September 2017- early January 2018, negative sub-surface anomalies persisted in those regions.
9 Since late December 2017, a downwelling Kelvin wave has contributed to the eastward shift of above-average sub-surface temperatures. Equatorial oceanic Kelvin waves have alternating warm and cold phases. The warm phase is indicated by dashed lines. Down- welling and warming occur in the leading portion of a Kelvin wave, and up-welling and cooling occur in the trailing portion. Low-level (850-hPa). Zonal (east-west) Wind Anomalies (m s-1). Low-level easterly wind anomalies generally persisted over the central and western equatorial Pacific from May- October 2017. From January-October 2017, westerly wind anomalies were generally observed over the eastern Pacific Ocean.
10 From mid-October to early November 2017 and from early December 2017 to the present, the Madden Julian Oscillation (MJO) disrupted the pattern, contributing to the eastward propagation of low-level wind anomalies. Westerly Wind Anomalies (orange/red shading). Easterly Wind Anomalies (blue shading). Upper-level (200-hPa). Velocity Potential Anomalies Since at least April 2017, anomalous upper-level divergence (green shading). generally persisted near Indonesia, while anomalous convergence (brown shading). persisted near the Date Line. Eastward propagation of regions of upper-level divergence (green shading).