Transcription of Equal Opportunity Employer/Program
1 Helping Mississippians Get Jobs Equal Opportunity Employer/Program Auxiliary aids and services available upon request to individuals with disabilities: TTY 800-582-2233. April 2018. Table of Contents Seasonally Adjusted Labor Force Data .. ii Labor Force Unemployment Rates (County Rankings) ..2. County Rate Map ..3. Statewide Unadjusted Unemployment Rates Graph ..4. Unadjusted Labor Force and employment Security Data ..5. Labor Force Estimates ..6. Twelve Month Moving Averages ..12. Five Year History of Unemployment Rates ..14. Unemployment Insurance Statistics ..17. Area Descriptions.
2 22. Description of the Unemployment Rate Calculation ..26. Glossary of Terms ..27. Prepared by: Labor Market Information Department Email: Funded by: Department of Labor, Bureau of Labor Statistics Seasonally Adjusted Labor Force and Non-Farm employment Data Statewide Unemployment Rate seasonally adjusted Percent Seasonally Adjusted Non-Farm employment Estimates Preliminary Revised Revised April 2018 March 2018 April 2017. mississippi 1,164,500 1,165,600 1,149,600. United States 148,424,000 148,260,000 146,144,000. Seasonally Adjusted Non-Farm employment Estimates Preliminary Revised Revised mississippi April 2018 March 2018 April 2017.
3 Civilian Labor Force 1,275,200 1,273,800 1,282,300. Unemployed 58,200 57,300 67,900. Unemployment Rate Employed 1,217,000 1,216,500 1,214,400. Preliminary Revised Revised United States April 2018 March 2018 April 2017. Civilian Labor Force 161,527,000 161,763,000 160,181,000. Unemployed 6,346,000 6,585,000 7,021,000. Unemployment Rate Employed 155,181,000 155,178,000 153,161,000. ii mississippi Labor Market Data Labor Force Highlights for April 2018. Labor force data presented are rounded estimates. Seasonally Adjusted The seasonally adjusted unemployment rate for April 2018 was percent.
4 The state's seasonally adjusted series reported an over the month increase of one-tenth of a percentage point from in March. When compared to one year ago, the rate was seven-tenths of a percentage point lower than the percent reported for April 2017. The Nation's seasonally adjusted unemployment rate decreased two-tenths of a percentage point over the month to percent, and was five-tenths of a percentage point lower than the year ago rate of percent. In April 2018, the Civilian Labor Force, which is made up of everyone who has a job or is looking for a job, increased 1,400 over the month to 1,275,200.
5 The number of Mississippians working rose in April by 500 to 1,217,000. More Mississippians were employed than at any time since July 2008. The number of unemployed Mississippians increased over the month by 900 to 58,200. In April 2018, there were 1,100 fewer jobs in mississippi than in March 2018, but 14,900 more than April 2017, according to the seasonally adjusted results from a survey of mississippi employers . Seasonally adjusted data removes the effects of events that follow a more or less regular pattern each year such as the influences of weather, holidays, the opening and closing of schools, and other recurring seasonal events.
6 These adjustments make it easier to observe the cyclical and other non- seasonal movements in a data series. Amounts are seasonally adjusted at the National and State levels only. Unadjusted mississippi 's not seasonally adjusted unemployment rate for April 2018 was percent, decreasing one-tenth of a percentage point from the previous month's rate of percent. When compared to the April 2017 rate of percent, the rate decreased four-tenths of a percentage point. The number of unemployed decreased 700 over the month, while the employed total increased 5,400 from the prior month. The Nation's not seasonally adjusted unemployment rate for April 2018 at per- cent was down four-tenths of a percentage point from percent in March 2018 and April 2017.
7 mississippi 's not seasonally adjusted nonfarm employment increased 3,500 over the month and 13,700 over the year. Industry sectors registering the largest monthly employment gains were Leisure & Hospitality; and Professional & Business Services. For the month of April 2018, twenty-five counties in mississippi posted unemployment rates less than or Equal to the state's rate of percent. Rankin County posted the lowest unemployment rate for the month of April at percent followed by Union County at percent. Jefferson County had the highest unemployment rate for April at percent followed by Issaquena Coun- ty at percent.
8 mississippi Labor Market Data 1. Unemployment Rates April, 2018. (County Rankings). 1 Rankin 41 Montgomery 2 Union 41 Webster 3 Lamar 44 Copiah 3 Madison 44 Marion 5 DeSoto 44 Warren 5 Lee 47 Jackson 7 Pontotoc 47 Yazoo 7 Scott 49 Lawrence 9 Lafayette 49 Pike 10 Alcorn 49 Wayne 10 Itawamba 49 Winston 12 Grenada 53 Franklin 12 Smith 53 George 14 Calhoun 53 Greene 14 Prentiss 53 Perry 14 Tippah 57 Amite 17 Forrest 57 Bolivar 17 Oktibbeha 57 Stone 17 Simpson 60 Carroll 20 Harrison 60 Clay 20 Hinds 62 Adams 20 Lincoln 62 Attala 20 Tishomingo 62 Jasper 24 Covington 65 Clarke 24 Neshoba 66 Jefferson Davis 26 Choctaw 66 Panola 26 Lowndes 68 Walthall 26 Marshall 69
9 Sharkey 26 Monroe 70 Coahoma 26 Pearl River 70 Noxubee 26 Tallahatchie 72 Washington 32 Chickasaw 73 Leflore 32 Hancock 74 Quitman 32 Leake 74 Sunflower 32 Tate 76 Kemper 32 Yalobusha 77 Wilkinson 37 Jones 78 Humphreys 37 Lauderdale 79 Claiborne 37 Newton 80 Holmes 37 Tunica 81 Issaquena 41 Benton 82 Jefferson mississippi - Note: Unless indicated state and county data presented are not seasonally adjusted. 2 mississippi Labor Market Data mississippi Unemployment Rates by County April 2018. DeSoto Alcorn mississippi Benton Tippah Marshall Tishomingo Tunica Tate Prentiss Union Panola Lafayette Lee Itawamba Quitman Pontotoc Coahoma Yalobusha Tallahatchie Calhoun Chickasaw Monroe Bolivar Grenada Clay Webster Sunflower Leflore Montgomery Carroll Oktibbeha Lowndes Choctaw Washington Humphreys Holmes Noxubee Attala Winston Sharkey Issaquena Yazoo Leake Neshoba Kemper Madison Warren Scott Newton Lauderdale Hinds Rankin Smith Jasper Clarke Claiborne Simpson Copiah Jefferson Covington Jones Wayne Lawrence Jeff Davis Lincoln Adams Franklin Marion Lamar Greene Wilkinson Amite
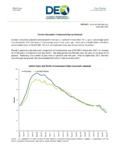
10 Pike Forrest Perry Walthall George Stone Pearl River Unemployment Rates - Jackson Hancock Harrison - - - Source: Labor Market Data Publication Design: Labor Market Information Department, MDES. mississippi Labor Market Data 3. Not Seasonally Adjusted Statewide Unemployment Rate not seasonally adjusted Percent Unemployment Insurance Initial Claims . 10. Thousands Claims Filed 8. 6. 4. 2. Unemployment Insurance Benefits Paid . 10. Claims Paid Millions 8. 6. 4. 2. Unemployment insurance amounts presented in this section only represent regular UI benefits;. federal program amounts are not included.