Transcription of Equations and their Graphs - Mathematics | SIU
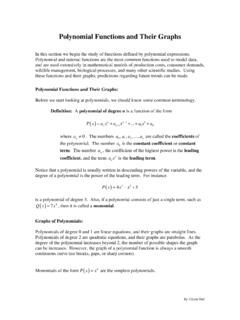
1 Equations and their Graphs I. LINEAR Equations . A. Graphs . Any equation with first powers of x and/or y is referred to as a linear equation. When graphed, all ordered ( x, y ) pairs that satisfy a linear equation form a straight line. Example. Find 4 ordered pairs (including x and y intercepts) that satisfy 2 x + 3 y = 8 . graph the line. 2(0) + 3 y = 8. y = 8 / 3 (0,8 / 3) ( 2,4) . (0,8/3). 2( 2) + 3 y = 8.. y = 4 ( 2,4) y intercept (4,0).. 2 x + 3(0) = 8. y = 4 (4,0) x intercept (7, 2).. 2 x + 3( 2) = 8. x = 7 (7, 2). Here are 3 more examples of Graphs of linear Equations .
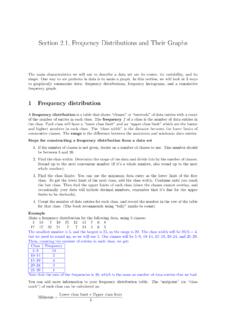
2 Y = 3x 4. (2, 4).. (2, 0). (4/3, 0) . (4, 4). (2, 2). ( 6, 4). (0, 4) . (0, 4) y = 4. x =2. Equations and their Graphs Page 2. B. SLOPE. The most important characteristic of a line is the value assigned to the ratio comparing the amount of vertical change to horizontal change. Known as slope, this value can be defined in many ways: change in y rise y2 y1 y slope or m = = = =. change in x run x2 x1 x delta means change In this course, slope will often be described as the Rate of Change and will (eventually) be associated with the term Derivative. Example.
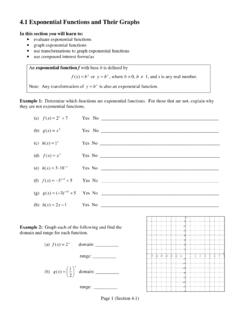
3 Find the rate of change for each of the following lines. a). y = 3x (6, 2). 1. (3, 1) Rise = 1 Rate of change =. Run = 3 3. 1. m=. 3. ( 3, 4). b) 8 . 1, 2x + 3y = 6. 3 . Using ( 1, 8/3) and (4, 2/3), 10 10. y= . y2 y1 = 9 3 . y 10 1 2. 2 m= = 3 = = . 4, x 5 3 5 3. 3 . x=5. (6, 2) Using ( 3, 4) and (6, 2), x2 x1 = 6. y y 6 2. m= 2 1 = = . x2 x1 9 3. Notice that the rate of change of a line does not depend on the points selected. Equations and their Graphs Page 3. c). (2, 5).. 5 1 4. (2, 1) m= =. 2 2 0. Since division by 0 is undefined, a vertical line is said to have "No Slope".
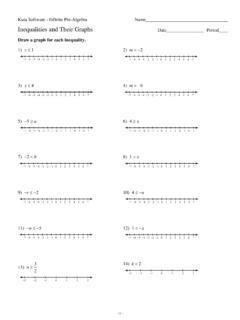
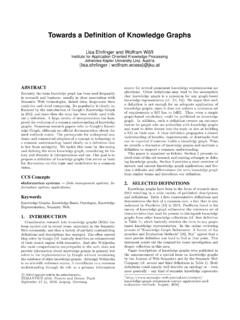
4 Horizontal lines have slope 0. x=2. C. TANGENT LINES. Question: Can there be a rate of change for nonlinear Equations ? Answer: Yes. But in order to discuss rate of change (and still use our original concept of slope), we will look at lines that are tangent to a given curve. Here is a curve with several tangent lines.. 1 3 4 6 8. Even without calculating the slopes of these lines, several conclusions may be drawn. 1) At x = 1 and 3, the tangent lines run uphill and, thus, have positive slope. The slope at x = 1 is greater since its tangent line is steeper.
5 2) The tangent line at x = 6 has a negative slope. 3) At x = 4 , the tangent line appears to be horizontal and thus has slope 0. Notice that when the rate of change is 0, the graph has reached its highest point. Equations and their Graphs Page 4. Exercise 1. Which of the following tangent lines have a) m > 0 ? b) m < 0 ? c) m = 0 ? 2. 1 5. 3.. 4. Answers II. QUADRATIC Equations . Only linear Equations have Graphs that result in lines. The Graphs of all nonlinear Equations will be curves . An equation in the form y = ax 2 + bx + c ( a 0 ), is referred to as Quadratic and its graph is a parabola.
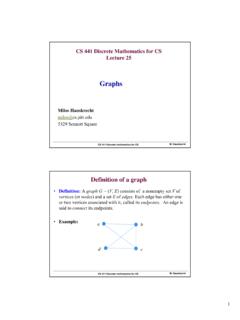
6 Here are examples of the Graphs of two quadratic Equations along with the tables used to find points on each. Example. y = 4 x 2. (0, 4). x y . 0 4 ( 1, 3) (1, 3). 1 3 . 1 3. 2 0. 3 5 ( 2, 0) (2, 0).. A parabola that opens down is said to be concave down . The point (0, 4) is known as the vertex. ( 3, 5) (3, 5).. Equations and their Graphs Page 5. Example. y = x 2 4 x 5. x y 0 5. 1 8. 3 8. ( 1, 0). 5. 6. 0. 7. (5, 0). 1 0. This parabola is concave up with vertex at (2, 9). The vertex is so important that we'll (0, 5) . give you a formula to find it. Start by finding.
7 (2, 9). b the x value using x = . 2a b ( 4 ). x= = =2. 2a 2(1). Now substitute to find y. y = 2 2 4 ( 2 ) 5 = 9. We can also say that 9 is the minimum value of the equation. In our first example, 4 is the maximum value. Notice that a tangent line drawn at a minimum or maximum is horizontal. Are you beginning to see a pattern? Horizontal tangent lines slope 0 maximum or minimum values . b Exercise 2. graph each parabola. Start by determining the vertex using x = . Then find 2a 2 points on each side of the vertex as well as x and y intercepts. State the maximum or minimum value.
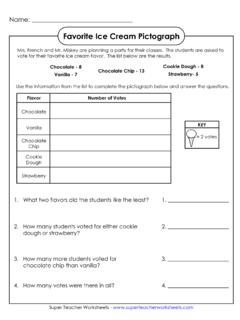
8 A) y = x 2 3. b) y = x 2 4 x Answers c) y = 6 x x 2. d) y = x 2 + 6 x + 7 Answers Equations and their Graphs Page 6. III. POLYNOMIALS. Any equation higher in degree than a quadratic (quadratics are 2nd degree) is given the name polynomial. As demonstrated below, the graph of a polynomial winds up and down. 2. 3 6. Let us discuss three important characteristics of a polynomial. 1. Turning Points Whereas a quadratic has only one turning point (either or ), a polynomial may have several. Known as extrema, these high and low points are designated as maximum or minimum.
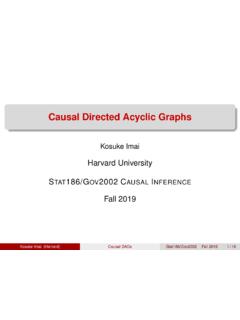
9 The graph above has a maximum at x = 3 and 6 and a minimum at x = 2 . Let me remind you tangent lines drawn to every extrema are horizontal which means their slope is 0. 2. End Behavior Question: What happens to y as x gets very large? What happens to y as x gets very small? Answering these questions will allow you to determine the behavior of the polynomial on each end. Equations and their Graphs Page 7. Example. Here are two polynomials with notation describing end behavior. as x , as x , y . y . as x , as x , y y . The arrow is read "approaches". In calculus, this same end behavior will be expressed using slightly different notation along with the term "limit".
10 We simply replace the term equation with function and the letter y with f (x) . Here are the same Graphs with their end behavior described using limit notation. f (x). limit f ( x) = . x . limit f ( x) = . x . limit p ( x) = . x . limit p ( x) = . x . p(x). Equations and their Graphs Page 8. 3. Increasing/Decreasing Except when it remains constant (indicated by a horizontal line), an equation or function is either increasing or decreasing. Here is what we mean. a b a b a b a b The Graphs above are said The Graphs above are to be increasing on (a, b). decreasing on (a, b).