Transcription of Error Distribution Variances and Other Statistics1
1 Error Distribution Variances and Other Statistics1 Dr. Howard Castrup Integrated Sciences Group 1/15/2009 Introduction This monograph was developed in response to customer inquiries concerning the expressions used to represent the standard deviations (standard uncertainties) of the various Error probability distributions employed in ISG software and elsewhere. The following develops these standard deviations, showing in detail the steps involved. For each Distribution , the steps may vary, but the basic procedure is to first develop an expression for the Distribution variance 2, from which the standard deviation follows immediately.
2 Distribution variance - The General Expression For a random variable with probability Distribution function (pdf) f( ) and mean , the variance is given by 22()()fd = . (1) For Error distributions, is taken to be zero, and Eq. (1) reduces to 22()fd = . (2) The Normal Distribution The normal Distribution is the workhorse of statistics and probability.
3 It is usually assumed to be the underlying Distribution for random variables. Indeed, the various tools we use in applying uncertainty estimates are nearly always based on the assumption that measurement errors are normally distributed, regardless of the distributions used to estimate the uncertainties themselves. The pdf The pdf for a normally distributed random variable with mean 0 and standard deviation is given by 22/21()2fe =. (3) The variance 2 is the square of the standard deviation.
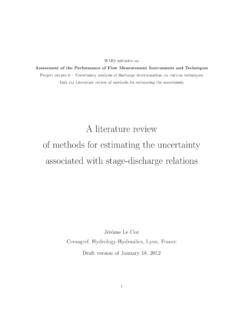
4 0f( ) L-L0f( ) L-L Figure 1. The Normal Distribution . Shown is a case where the Error Distribution mean value is zero. The limits L are approximate 95% confidence limits. 1 Much of the material in this monograph is taken from Castrup, H., Selecting and Applying Error Distributions in Uncertainty Analysis, presented at the Measurement Science Conference, Anaheim, 2004. Error Distributions and Other Statistics Integrated Sciences Group 2 Applicability of the Normal Distribution We usually assume a normal Distribution .
5 Why? The primary reason is because this is the Distribution that either represents or approximates what we frequently see in the physical universe. It can be derived from the laws of physics for such phenomena as the diffusion of gases and is applicable to instrument parameters subject to random stresses of usage and handling. It is also often applicable to equipment parameters emerging from manufacturing processes. An additional consideration applies to the Distribution we should assume for a total Error or deviation that is composed of constituent errors or deviations.
6 There is a theorem called the central limit theorem that demonstrates that, even though the individual constituent errors or deviations may not be normally distributed, the combined Error or deviation is approximately so. An argument has been presented against the use of the normal Distribution in cases where the variable of interest is restricted, , where values of the variable are said to be bound by finite physical limits. This condition notwithstanding, the normal Distribution is still widely applicable in that, for many such cases, the physical limits are located far from the population mean.
7 The Uniform Distribution The uniform Distribution has limited applicability to errors in measurement and has virtually no applicability to biases of equipment parameters. For the latter, it can be argued that it is not a physically credible Distribution . Despite its unphysical character, applying the uniform Distribution to obtain Type B uncertainty estimates is a practice that has been gaining ground over the past few years. There are two main reasons for this: Ease of Use Applying the uniform Distribution makes it easy to obtain an uncertainty estimate.
8 If the limits a of the Distribution are known, the uncertainty estimate is computed using Eq. (6). It should be said that the "ease of use" advantage should be tempered by the following warning:2 "When a component of uncertainty is determined in this manner contributes significantly to the uncertainty of a measurement result, it is prudent to obtain additional data for its further evaluation." At our present level of analytical development,3 the ease of use advantage is more difficult to justify than previously. Given the emergence of new methods and tools, the only excuse for not using a physically realistic Distribution , applying a containment probability and estimating the degrees of freedom (if appropriate) is that the information for doing so is either (1) not at our fingertips or (2) it puts too much of a strain on technicians that are not trained in estimating GUM Authority It has been asserted by some that the use of the uniform Distribution is (uniformly?)
9 Recommended in the This is not true. In fact, most of the methodology of the GUM is based on the assumption that the underlying Error Distribution is normal. 2 Quoted from Section of the GUM. 3 Castrup, S., A Comprehensive Comparison of Uncertainty Analysis Tools, Proc. Measurement Science Conference, January 2004, Anaheim. 4 Since the goal of ensuring accurate measurements often involves the investment of considerable management and engineering time, equipment acquisition expenditures and proficiency training costs, it seems curious that, just when we get to the payoff, we become lazy and sloppy.
10 5 ANSI/NCSL Z540-2, Guide to the Expression of Uncertainty in Measurement, 1st Ed., 1997, Boulder. Error Distributions and Other Statistics Integrated Sciences Group 3 Another source of confusion is that some of the examples in the GUM apply the uniform Distribution in situations that appear to be incompatible with its use. It is reasonable to suppose that much of this is due to the fact that rigorous Type B estimation methods and tools were not available at the time the GUM was published, and the uniform Distribution was an "easy out.