Transcription of THE USE OF RAIN RADAR MEASUREMENTS FOR HYDRAULIC MODELLING
1 THE USE OF rain RADAR MEASUREMENTS FOR HYDRAULIC MODELLING Tom Joseph 1, Luke Sutherland-Stacey 2, Nathan Donald 1, Geoff Austin 3 1. Mott MacDonald, Auckland, New Zealand 2. , Auckland, New Zealand 3. Physics Department, University of Auckland, New Zealand ABSTRACT It is nearly impossible to accurately quantify rainfall variability across a stormwater or sewer catchment using discrete point rainfall MEASUREMENTS . The variability across the catchment can be significant depending on the catchment location and surrounding terrain. For many hydrological applications, such as sewer inflow and infiltration MODELLING , extrapolation of point rainfall MEASUREMENTS is standard practice and is one of largest unknowns in the model. Decisions about the techniques used for extrapolation, as well as the adequacy of the conclusions drawn from the MODELLING results, depend heavily on the magnitude and the nature of the uncertainty involved.
2 In this paper we will outline our recent investigation using accurate short range RADAR in an attempt to quantify how standard point rainfall measurement and extrapolation techniques effect sewer model calibration and eventually options resulting from the model. In the highlighted case study we completed a detailed sewer model calibration using current industry best practice. As a second work stream we obtained RADAR data from the University of Auckland s short range mobile RADAR unit for the entire monitoring period. We then tested the model calibration using the true rainfall distribution over each sewer-catchment as identified from the RADAR and commented on the variation in model calibration parameters and how the different rainfall distribution effects the perceived system performance and potential options analysis.
3 INTRODUCTION It is common across New Zealand and other parts of the world to build hydrologic and HYDRAULIC models of sewer and storm water infrastructure for planning purposes. The models are typically used to develop comprehensive master plans across the catchment which drive large capital expenditures for mitigating current system performance issues ( combined sewer overflows, flooding) and planning for future growth. Having a robust calibrated hydrologic and HYDRAULIC model is critical to planning cost effective and focused solutions. Accurate rainfall accumulations are therefore an essential boundary condition for all these models. Too often rainfall data quality is taken for granted and the spatial variability in the data is often not well understood.
4 In the case of New Zealand storms generally show high spatial and temporal variability which is difficult to capture using typical discrete point rainfall MEASUREMENTS . The traditional engineering approach to obtaining rainfall boundary conditions is to make use of tipping bucket rain gauges at a density of approximately 1 every 2 to 4 km2 depending upon the catchment terrain. However, this standard is often not adhered too due to cost and over large regions this is not always practical. An additional concern with using rain gauges is that a collection of sparse point MEASUREMENTS may not be able to properly characterise the extreme spatial gradients which are known to exist in precipitation fields (Morrissey et al., 1995, Steiner, 1996, Nystuen, 1998, Villarini et al.)
5 , 2008). Essentially, hydrologically significant rainfall may either fit between rain gauges, in which case it is not sampled, or it may be incident on members of a gauge network but not present in unmeasured areas, in which case oversampling occurs. Either scenario will bias the rainfall boundary conditions in sewer models, leading to poorer model predictive skill. A complimentary source of rainfall information is available from weather RADAR MEASUREMENTS . Weather RADAR generate spatial maps of rain location and infer instantaneous rainfall rate by measuring the intensity of reflection (backscatter) of electromagnetic radiation off falling raindrops (after Marshal 1953 and Marshal and Palmer, 1948). Careful processing of RADAR data is necessary to retrieve surface rainfall rate from RADAR reflectivity MEASUREMENTS made aloft (for a recent review, see Villarini and Krajewski, 2010).
6 Some of the sources of error in the estimation process are the uncertainty in the observed rainfall s drop size distribution (Twomey, 1953, Battan, 1973, Atlas et al., 1999), beam blocking (Harrold et al., 1974, Andrieu et al., 1997) and uncertainty in the knowledge of the vertical distribution of rain (Fabry et al., 1992, Kitchen et al., 1994, Joss and Lee, 1995). The resulting effects on the estimation of rainfall rate have been researched extensively over the past decades. Comparison of RADAR retrieved estimates of rainfall with point rain gauge MEASUREMENTS can indicate how well these errors have been accounted for and corrected. For most engineering applications the best estimates of surface rainfall accumulation depth can be made by combining both RADAR and rain -gauge MEASUREMENTS (Wright et al, 2014).
7 Composite fields contain both point rain rate information from direct in-situ rain gauge MEASUREMENTS and information about the spatial distribution of rainfall from RADAR MEASUREMENTS and can be prepared in raster formats suitable for ingestion into distributed models. International work has highlighted the MODELLING improvements made possible by these composite MEASUREMENTS . Lowe et al (2014) reported improvements in urban runoff MODELLING when using composite RADAR -gauge fields over the same rain gauge only MEASUREMENTS . The improvement in spatial sampling afforded by RADAR MEASUREMENTS can offset RADAR uncertainties and result in improvements in model response. Sempere-Tores et al (1999) compared RADAR only and rain gauge only data for driving combined sewer system (CSS) flow models and found that RADAR data better reproduced observed flow, despite some point wise disagreements with rain gauge MEASUREMENTS .
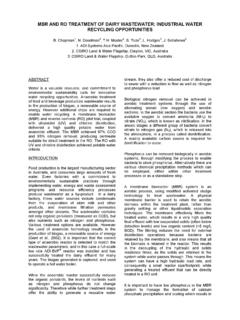
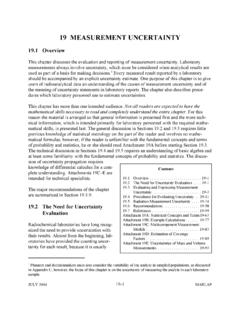
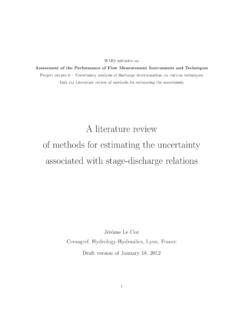
8 The extra spatial information contained in RADAR MEASUREMENTS of rainfall has also been put to use MODELLING pollution buildup and runoff (Shaw et al 2010) and forecasting sewer overflow risk (Heinonen et al 2013). In this work we investigate the impact of high resolution rain RADAR and rain -gauge fields on a network sewer model of the Onehunga catchment in Auckland New Zealand. In the analysis we utilized a traditionally calibrated hydrologic/ HYDRAULIC model to make an assessment on how discrete rainfall MEASUREMENTS might skew calibration parameters when spatial rainfall variation is persistent. METHODOLOGY Study Catchment The study area is located on the south east of the Auckland Isthmus (Figures 1 and 2).
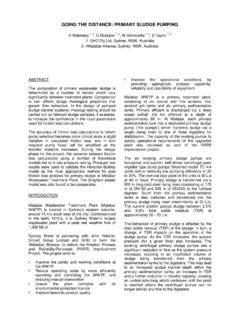
9 The total contributing area is approximately 2,107 Ha (from Project Storm 2) and accommodates a total population of 46,776 (2006). Approximately half of the catchment is residential, while industrial and open space covers nearly 20% each and the remaining 5% area is commercial activities. Figure 1: GIS output indicating the catchment boundary, sewer network flow monitoring and rain gauge locations. The locations of two test sub-catchments is indicated with dashed circles Figure 2: Location of the catchment and project rain gauges within the Auckland Isthmus. The RADAR location (red triangle), measurement arc (dashed line) and locations of permanent rain gauges (red squares) are also indicated. RADAR Data Collection RADAR observations were provided by the University of Auckland High Resolution Trailer RADAR .
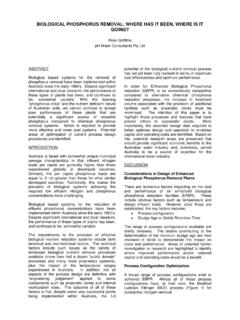
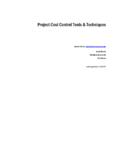
10 The Trailer RADAR consists of a fully articulated diameter RADAR dish mounted on a short tower, coupled by flexible waveguide to a 25kW masthead transceiver, the outputs of which are in turn fed, along with information regarding the dish direction, into a PC housed in a small operator s cab. The RADAR system is entirely self-contained on a tandem axle trailer. The total mass is about tonnes, allowing it to be towed by a light four wheel drive vehicle; provided that the trailer s HYDRAULIC breaking system is used. The RADAR mast is folded down onto the trailer for transport. A complete description of the RADAR system and discussion of its suitability for small catchment monitoring may be found in Sutherland-Stacey et. al. (2011). Figure 3: The University of Auckland high resolution rain RADAR overlooking the study catchment.