Transcription of Example of Interpreting and Applying a Multiple …
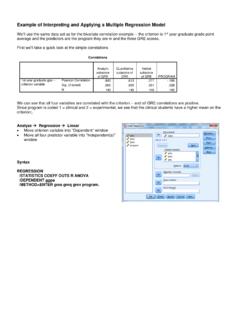
1 Example of Interpreting and Applying a Multiple regression model We'll use the same data set as for the bivariate correlation Example -- the criterion is 1st year graduate grade point average and the predictors are the program they are in and the three GRE scores. First we'll take a quick look at the simple correlations Correlations Analytic Quantitative Verbal subscore subscore of subscore of GRE GRE of GRE PROGRAM. 1st year graduate gpa -- Pearson Correlation .643 .613 .277 criterion variable Sig. (2-tailed) .000 .000 .001.
2 028. N 140 140 140 140. We can see that all four variables are correlated with the criterion -- and all GRE correlations are positive. Since program is coded 1 = clinical and 2 = experimental, we see that the clinical students have a higher mean on the criterion;. Analyze regression Linear Move criterion variable into "Dependent" window Move all four predictor variable into "Independent(s)". window Syntax regression . /STATISTICS COEFF OUTS R ANOVA. /DEPENDENT ggpa /METHOD=ENTER grea greq grev program. SPSS Output: Does the model work?
3 model Summary Adjusted Std. Error of Yep -- significant F-test of H0: that R =0. model R R Square R Square the Estimate 1 .758a .575 .562 .39768 If we had to compute it by hand, it would be . a. Predictors: (Constant), Verbal subscore of GRE, PROGRAM, Quantitative subscore of GRE, Analytic R / k subscore of GRE. F = --------------------------------- (1 - R ) / (N - k - 1). By the way, the "adjusted R " is intended to "control for" overestimates of the population R resulting from small samples, high collinearity or small subject/variable ratios.
4 Its perceived utility varies greatly across .575 / 4. research areas and time. = --------------------------- = (1 - .575) / 135. Also, the "Std. Error of the Estimate" is the standard deviation of the residuals (gpa - gpa'). As R increases the SEE will decrease F(4,120, .01) = (better fit less estimation error). So, we would reject this H0: and decide On average, our estimates of GGPA with this model will be to use the model , since it accounts for wrong by .40 not a trivial amount given the scale of GGPA. significantly more variance in the criterion variable than would be expected by chance.
5 ANOVAb Sum of Mean How well does the model work? model Squares df Square F Sig. 1 regression 4 .000a Accounts for about 58% of gpa variance Residual 135 .158. Total 139. a. Predictors: (Constant), Verbal subscore of GRE, PROGRAM, Quantitative subscore of GRE, Analytic subscore of GRE. b. Dependent Variable: 1st year graduate gpa -- criterion variable a Coefficients Unstandardized Standardized Coefficients Coefficients model B Std. Error Beta Sig. 1 (Constant) .454 .025. PROGRAM .070 .348. Analytic subscore of GRE .001 .549.
6 000. Quantitative subscore of GRE .000 .456 .000. Verbal subscore of GRE .001 .001. a. Dependent Variable: 1st year graduate gpa -- criterion variable Which variables contribute to the model ? Looking at the p-value of the t-test for each predictor, we can see that each of the GRE scales contributes to the model , but program does not. Once GRE scores are "taken into account" there is no longer a mean grade difference between the program groups. This highlights the difference between using a correlation to ask if there is bivariate relationship between the criterion and a single predictor (ignoring all other predictors) and using a Multiple regression to ask if that predictor is related to the criterion after controlling for all the other predictors in the model .
7 Take a look at the analytic subscale The b weight tells us that each added point on the GREA increases the expected grade point by .0065. Doesn't seem like much, but consider that a GRE increase of 100 leads to an GPA increase of about .65. Take a look at the verbal subscale This is a suppressor variable -- the sign of the Multiple regression b and the simple r are different By itself GREV is positively correlated with gpa, but in the model higher GREV scores predict smaller gpa (other variables held constant) check out the Suppressors handout for more about these.
8 Example Write-up Correlation and Multiple regression analyses were conducted to examine the relationship between first year graduate GPA and various potential predictors. Table 1 summarizes the descriptive statistics and analysis results. As can be seen each of the GRE scores is positively and significantly correlated with the criterion, indicating that those with higher scores on these variables tend to have higher 1st year GPAs. Program is negatively correlated with 1ST. year GPA (coded as 1=clinical and 2=experimental), indicating that the clinical students have a larger 1st year GPA.
9 The Multiple regression model with all four predictors produced R = .575, F(4, 135) = , p < .001. As can be seen in Table1, the Analytic and Quantitative GRE scales had significant positive regression weights, indicating students with higher scores on these scales were expected to have higher 1st year GPA, after controlling for the other variables in the model . The Verbal GRE scale has a significant negative weight (opposite in sign from its correlation with the criterion), indicating that after accounting for Analytic and Quantitative GRE scores, those students with higher Verbal scores were expected to have lower 1st year GPA (a suppressor effect).
10 Program did not contribute to the Multiple regression model . Table 1 Summary statistics, correlations and results from the regression analysis Multiple regression weights Variable mean std correlation with 1st year GPA b . 1st year GPA .612. GREA .643** .0065** .549. GREV .277** ** GREQ .613** .0034** .456. Program^ clinical 55 ( ) * Exper 48 ( ). ^ coded as 1=clinical and 2=experimental students * p < .05 ** p < .01 **p<.001. Applying the Multiple regression model Now that we have a "working" model to predict 1st year graduate gpa, we might decide to apply it to the next year's applicants.