Transcription of Excel Add-in Desktop Guide- i
1 Excel Add-in Desktop Guide- iImporting Data ..1 Import Data Wizard ..1 Fundamentals Analysis Wizard ..9 Data Transparency ..15 Searching for Fields ..17 Field Search Tool ..17 Bloomberg Formula Syntax ..20 Security Syntax ..20 Argument Syntax ..21 BDP ..22 BDH ..24 BDS ..26 BEQS ..28 Function Builder ..30 Calculation Overrides ..33 Formula Override Example ..33 Scenario Builder ..34 Screens and Steps .. 35 Template Library ..38 Populate Table ..40 Formula Conversion Tool ..42 Smart Tags ..44 Bloomberg Options ..46 General Tab ..47 Importing Data - 1 Importing Data Import Data WizardThe Import Data wizard enables you to find the data you are looking for and bring it into a spreadsheet.
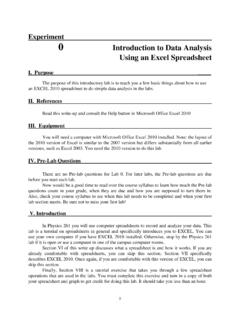
2 You can launch the Import Data wizard by, selecting Import Data from the Bloomberg Menu, or The Bloomberg Data wizard screen appears, as shown in Figure Data - 2 Table 1 details the different Data 1: Data Wizard ScreenImporting Data - 3 Table 1: Data Type Description Table Description StepsReal-time and current snapshot data, including pricing, descriptive, and fundamental Create a List of Securities2. Create a List of Fields3. Set Layout OptionsEnd-of-day data for a specified period of time in increments of days, weeks, months, quarters, or Create a List of Securities2. Create a List of Fields3. Select Periodicity and Time Frame4.
3 Set History Parameters5. Set Pricing Defaults 6. Set Layout OptionsIntraday market data for a speci-fied period of time in increments of minutes and using DPDF settings. Based on Bid, Ask, or Trade events, data such as open, high, low, close, and volume can be Create a List of Securities2. Set Intraday Parameters3. Set Pricing Defaults4. Set Layout OptionsIntraday market ticks for a specified period of time. Based on Bid, Ask, or Trade Create a List of Securities2. Set Intraday Parameters3. Set Layout OptionsCreate a List of SecuritiesAvailable for , enables you to create a list of securities by manually entering a security, or selecting securities from: Securities may also be stored that are specific to your Bloomberg login ID.
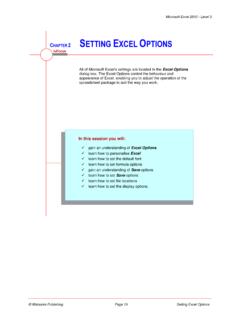
4 If you have saved securities to any of the following in the Bloomberg Terminal, you are able to load the lists directly into your list of securi-ties. Create a List of FieldsAvailable for , enables you to create a list of fields by: n Searching for a field mnemonic; or n Selecting a field from the category Data - 4 n Launchpad MonitorBLP <GO> n A Security ListLIST <GO> n NW MonitorNW <GO> n Equity ScreeningEQS <GO> n PortfolioPLST <GO> n Execution ManagementEMS <GO> n Equity indices n An Excel spreadsheetImporting Data - 5 Searching for a Field MnemonicSearching for a field mnemonic enables you to enter a keyword into the search text field and filters according to the asset class.
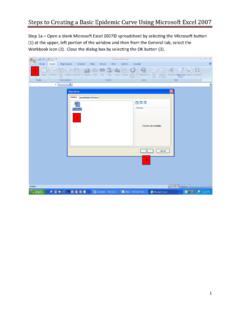
5 The List data grid then populates with all fields matching the text, as shown in Figure 2. Figure 2: List Populates n The icon denotes that the field is a DataSets field. n The icon denotes that the field is a RealTime field. n No icon denotes that the field is a Static Data - 6 Selecting a Field from the Category ListYou are able to select a specific field by drilling down into a specific category, as shown in Figure 3. Figure 3: Drilling down into Categories n To expand a section, click the + icon. n To collapse a section, click the Data - 7 Set Intraday ParametersAvailable for , enables you to set parameters according to: n Market Events, such as Trade, Bid and Ask; n Interval fields, such as Open, High, Low, Close, Tick Count, and Volume; n Time Frame; n Interval Size n Non-trading Layout OptionsAvailable for , enables you to set: n Data Placement n Multi-Sheet n Show Labels to include securities & Fields n Time Ordering n Field Orientation n Data Set aggregationSelect Periodicity and Time FrameAvailable for , enables you to set: n Periodicity according to Calendar Type.
6 And n A Fixed Time Series or Relative Time Pricing DefaultsAvailable for , enables you to set:Set History ParametersAvailable for , enables you to set:Importing Data - 8 n Whether to follow DPDF Settings n Cash Adjustment Normal n Cash Adjustment Abnormal and n Capital Changes n Currency n Non-Trading Days n Quote n Quote CalculationImporting Data - 9 Fundamentals Analysis WizardThe Fundamentals Analysis wizard enables you to import Fundamentals data into a spreadsheet. You can launch the Fundamental Analysis wizard by, selecting Fundamentals Analysis from the Bloomberg Menu, or The Fundamentals Analysis wizard screen appears, as shown in Figure Data - 10 Figure 4: Fundamental Analysis ScreenTable 2 details the different Data 2: Data Type Description Table Importing Data - 11 Description StepsThe Fundamental Data path is composed of templates and is designed to retrieve end-of-day data for a specified period of time in increments of days, weeks, quarters, or Create a List of Securities2.
7 Create a List of Templates3. Set Parameters4. Set Layout OptionsOnce the data imports use Bloomberg Data Transparency to further examine the data. For additional details, see Bloomberg Data Transparency on page Estimates lets you display earnings projections, for a specific equity or group of equities, so you can quickly gauge market Create a List of Securities2. Create a List of Fields3. Select Data Source4. Select History Type5. Select Periodicity and Time Frame6. Set Layout OptionsCreate a List of SecuritiesAvailable for , enables you to create a list of securities by manually entering a security, or selecting securities from:Securities may also be stored that are specific to your Bloomberg login ID.
8 If you have saved securities to any of the following in the Bloomberg Terminal, you are able to load the lists directly into your list of a List of FieldsAvailable for , enables you to create a list of fields by: n Searching for a field mnemonic or n Selecting a field from the category Data - 12 n Launchpad MonitorBLP <GO> n A Security ListLIST <GO> n NW MonitorNW <GO> n Equity ScreeningEQS <GO> n PortfolioPLST <GO> n Execution ManagementEMS <GO> n Equity indices n An Excel spreadsheetCreate a List of TemplatesAvailable for , enables you to create a list of templates by selecting: n Fundamental Data (computed by Bloomberg analysts) n Standardized, As Reported Data (standardized by Bloomberg Analysts) n As Reported Data (as stated by the company)Once you have selected a data type you are able to select available ParametersAvailable for , enables you to set parameters according to: n Display Criteria, such as Display Order, Filing Status, Currency, and Consolidation Level n Periodicity according to Calendar Type and Annual basis and n A Time frame from a Fixed time series or Relative time seriesImporting Data - 13 Select Data SourceAvailable for , enables you to select a data source including.
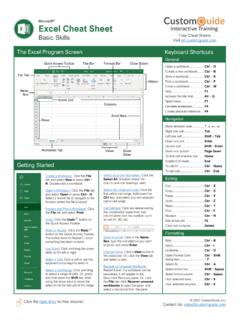
9 N BEst Standard n BEst Leading Indicator (28 Days) n BEst Post-Event n BrokerSelect History TypeAvailable for , enables you to select a history type, options include: n Currency n Discrete n Consolidation Level n Relative Time Period n Revision n Non-trading day inclusionImporting Data - 14 Select Periodicity and Time FrameAvailable for , enables you to set: n Periodicity according to Calendar Type n A Fixed Time Series or Relative Time SeriesSet Layout OptionsAvailable for , enables you to set:Data TransparencyThe Bloomberg Data Transparency tool is available in conjunction with data returned using the Fundamental Data wizard. This tool enables you to view the value look-up and the composite numbers that make up the value.
10 You are also able to drill down multiple levels and return a transparency Data - 15 n Data Placement n Multi-Sheet n Show Labels to include n Time Ordering n Field Orientation n Data Set aggregationThe legend for the pane includes: Figure 5: Bloomberg Data Transparency Screen n To expand a section, click the + icon. n To collapse a section, click the icon Importing Data - 16 GreenDenotes a composite value for the currently selected line item. Any value shown in green contains additional values and you can drill a source document. You cannot drill down. Clicking on a blue title launches a for FieldsField Search ToolThe Field Search Tool enables you to locate Bloomberg field mnemonics for different market sectors and provides the option of saving user created lists as a launch the Field Search tool, select Field Search from the Bloomberg Menu, or You are able to create a list of fields by: n Searching for a field mnemonic by keyword.