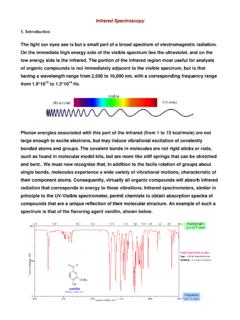
Transcription of Experiment 11 — Infrared Spectroscopy
1 Chem 22 Spring 2010 1 Experiment 11 Infrared Spectroscopy _____ Pre-lab preparation. (1) In Ch 5 and 12 of the text you will find examples of the most common functional groups in organic molecules. In your notebook, provide generic examples of the following compound classes: (a) alkane, (b) alkene, (c) alkyne, (d) alkyl halide, (e) alcohol, (f) amine, (g) ether, (h) aldehyde, (i) ketone, (j) carboxylic acid, (k) ester, (l) anhydride, (m) amide, (n) acyl halide, (o) nitrile, (p) arene (this term usually implies a benzenoid aromatic compound; draw benzene as an example), (q) there are lots more, but did we miss any common ones?
2 Now for a little refresher on structures and (2) Compounds in these classes can contain rings, of course, but for which classes can the functional group itself be part of a ring? For example, the O of an ether can be within a ring, but the OH of an alcohol cannot (why?!) (3) Note that there are several different types of amines and amides classified as 1 , 2 , and 3 . Draw a generic example of each. (4) Which compound classes contain a carbonyl group?
3 (5) This lab is designed so that you do NOT need to read the IR chapter in the text first! (you're welcome) In fact, after you complete this Experiment , you will be able to breeze right through that chapter. Whoosh. You were introduced to IR Spectroscopy last semester during the cyclclohexene lab. You may remember that we heated cyclohexene in the presence of a black Pd/C catalyst and found that alkenes had gotten together and decided to swap Hs to make cyclohexane and benzene, as indicated by GC and IR of the final hydrocarbon mixture.
4 IR was able to provide some indications of key structural changes that took place, though the changes were rather subtle in that case. For most common classes of organic compounds, IR will provide clear indications of functional groups and other structural features that may be present. Experiment 11 Spring 2010 2 Infrared Spectroscopy measures the frequencies of IR light absorbed by a sample and the intensities of the absorptions. The vibrational frequencies depend on the nature of the vibration (bending vs stretching), bond strengths, and the masses of the atoms involved in the vibration.
5 The intensities depend on the change in dipole moment that accompanies the vibration as well as the number of bonds involved. While an appreciation of these factors is helpful in understanding an IR spectrum, it is often sufficient simply to recognize the general frequency range and appearance of an absorption peak to determine what functional group is present. In Part 1 of this Experiment , you will compare and contrast actual IR spectra of a variety of different compounds and determine what key absorptions are characteristic of each functional group or can be attributed reliably to other specific structural features.
6 This part is going to be done at your lab bench with a series of IR spectra cards. In Part 2, you'll be running your very own IR spectra on the new, ultra-high-tech ATR FT-IR (Attenuated Total Reflectance Fourier Transform IR) This instrument is especially good for obtaining spectra of solids, such as the ones you saved from last semester fluorenone, benzoic acid, benzocaine, and acetanilide. You can do this part before, during, or after Part 1 whenever the instrument is free.
7 Part 1 Each group will find two decks of cards containing IR spectra and the structures of the compounds to which they belong. These decks will be used for all the lab sections, so please don't write on them. Your goal in this lab is to identify the important IR absorptions that are characteristic of certain compound classes and functional groups. You will also be looking at the variations within groups of similar compounds, the effect of having two or more functional groups in proximity, and effect of isotopic substitution.
8 Write the answers to the questions in your notebook as you go. Start by separating the spectra in the orange card set according to functional groups. Most of the important vibrations will be above 1500 cm 1. Notice that the fingerprint region (below 1500 cm 1) of is quite complex in most of the spectra. If you happen to notice some features in that region that are common to certain structural features, fine, but if you try to make sense out of every peak you'll never get finished.
9 1 Notice that in each spectrum there is an absorption for the C H stretches (these may be partly obscured by other stretches) around 3000 cm 1. Compare the C H stretches that you see Experiment 11 Spring 2010 3 in the various hydrocarbons (alkanes, alkenes, alkynes, aromatic compounds). Note that most of these have a cluster of peaks in the same place; in some cases additional peaks are present. How do you account for the presence of these extra peaks? That is, what's different about some of the C H stretches?
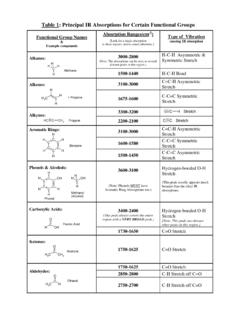
10 Are these C H bonds stronger or weaker than the main group? Why? 2 Now, focusing just on the informative region of each spectrum ( not the fingerprint region and not the C H stretches), what are the characteristic absorptions of each of the following compound classes? In some cases, the answer may be "none". What structural feature do you think is responsible for each key absorption ? a Alkane f Amine k Anhydride b Alkene g Nitrile l Ester c Alkyne h Aldehyde m Amide d Alcohol i Ketone e Ether j Carboxylic acid 3 Within several of these categories are both cyclic and acyclic compounds.

![[Fill-in-the-blank] tests measure and multiple choice ...](/cache/preview/5/e/e/9/b/f/1/7/thumb-5ee9bf17e1539b3a63fea89d05cad259.jpg)