Transcription of Experimental design and sample size determination
1 1 Experimental designand sample size determinationKarl W BromanDepartment of BiostatisticsJohns Hopkins ~kbromanNote This is a shortened version of a lecture which is part of a web-based course on Enhancing Humane Science/ImprovingAnimal Research (organized by Alan Goldberg, Johns HopkinsCenter for Alternatives to Animal Testing) Few details mostly design3 Basic question/goal in (aka blocking) experiments43 ExampleQuestion:Does salted drinking water affect blood pressure (BP) in mice? a mouse with water containing 1% 14 experiments are comparative. Compare BP in mice fed salt water to BP in micefed plain water. Compare BP in strain A mice fed salt water to BPin strain B mice fed salt , the Experimental group is compared toconcurrent controls (rather than to historical controls).
2 64 Replication7 Why replicate? Reduce the effect of uncontrolled variation( , increase precision). Quantify related point:An estimate is of no value without some statement of the uncertainty in the subjects ( units ) should be assigned totreatment groups at random does not mean needs to explicitly randomize using A computer, or Coins, dice or randomize? Avoid bias. For example: the first six mice you grab may have intrinsiclyhigher BP. Control the role of chance. Randomization allows the later use of probability theory, andso gives a solid foundation for statistical Suppose that some BP measurements will be madein the morning and some in the afternoon.
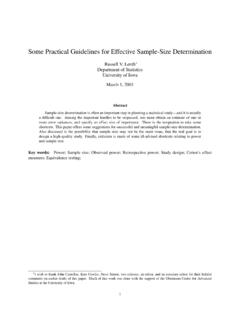
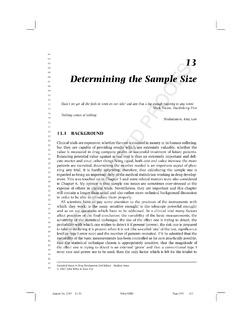
3 If you anticipate a difference between morning andafternoon measurements: Ensure that within each period, there are equal numbers ofsubjects in each treatment group. Take account of the difference between periods in youranalysis. This is sometimes called blocking .11 Example 20 male mice and 20 female mice. Half to be treated; the other half left untreated. Can only work with 4 mice per :How to assign individuals to treatmentgroups and to days?127An extremelybad design13 Randomized148A stratified design15 Randomizationand stratification If you can (and want to), fix a variable. , use only 8 week old male mice from a single strain.
4 If you don t fix a variable, stratify it. , use both 8 week and 12 week old male mice, and stratifywith respect to age. If you can neither fix nor stratify a variable, randomize we are interested in the effect of both saltwater and a high-fat diet on blood : look at all 4 treatments in one waterNormal dietSalt waterHigh-fat dietWhy? We can learn more. More efficient than doing all single-factorexperiments. 17 Interactions1810 Other points Blinding Measurements made by people can be influenced byunconscious biases. Ideally, dissections and measurements should be madewithout knowledge of the treatment applied. Internal controls It can be useful to use the subjects themselves as their owncontrols ( , consider the response after vs.)
5 Beforetreatment). Why? Increased points Representativeness Are the subjects/tissues you are studying reallyrepresentative of the population you want to study? Ideally, your study material is a random sample from thepopulation of Unbiased Randomization Blinding High precision Uniform material Replication Blocking Simple Protect against mistakes Wide range of applicability Deliberate variation Factorial designs Able to estimate uncertainty Replication RandomizationCharacteristics of good experiments:21 Data presentation0510152025303540 ABGroupBad plotGood plot2212 Data ( )C( )B( )A(SEM) ( )C( )B( )A(SEM)TreatmentGood tableBad table23 sample size determination2413 Fundamentalformulasample per $available $n=25 Listen to the IACUCToo few animals a total wasteToo many animals a partial waste2614 Significance test Compare the BP of 6 micefed salt water to 6 mice fedplain water.
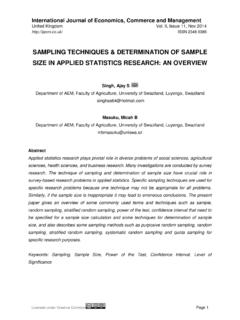
6 = true difference inaverage BP (the treatmenteffect). H0: = 0 ( , no effect) Test statistic, D. If |D| > C, reject H0. C chosen so that the chanceyou reject H0, if H0 is true, is5%Distribution of Dwhen = 027 Statistical powerPower = The chance that you reject H0 when H0 is false( , you [correctly] conclude that there is a treatmenteffect when there really is a treatment effect).2815 Power depends The structure of the experiment The method for analyzing the data The size of the true underlying effect The variability in the measurements The chosen significance level ( ) The sample sizeNote: We usually try to determine the sample size togive a particular power (often 80%).
7 29 Effect of sample size6 per group:12 per group:3016 Effect of the effect = : = :31 Various effects Desired power sample size Stringency of statistical test sample size Measurement variability sample size Treatment effect sample size 3217 Determiningsample sizeThe things you need to know: Structure of the experiment Method for analysis Chosen significance level, (usually 5%) Desired power (usually 80%) Variability in the measurements if necessary, perform a pilot study The smallest meaningful effect33A formula[]2n212/2 = zzCensored3418 Reducing sample size Reduce the number of treatment groups beingcompared.
8 Find a more precise measurement ( , averagetime to effect rather than proportion sick). Decrease the variability in the measurements. Make subjects more homogeneous. Use stratification. Control for other variables ( , weight). Average multiple measurements on each conclusions Experiments should be designed. Good design and good analysis can lead to reducedsample sizes. Consult an expert on both the analysis and thedesign of your ML Samuels, JA Witmer (2003) Statistics for the Life Sciences,3rd edition. Prentice Hall. An excellent introductory text. GW Oehlert (2000) A First Course in design and Analysis ofExperiments. WH Freeman & Co.
9 Includes a more advanced treatment of Experimental design . Course: Statistics for Laboratory Scientists ( , Johns Hopkins Bloomberg Sch. Pub. Health) Intoductory statistics course, intended for experimentalscientists. Greatly expands upon the topics presented