Example: barber
Power and Sample Size Determination
Power and Sample Size Determination Bret Hanlon and Bret Larget Department of Statistics University of Wisconsin|Madison November 3{8, 2011 Power 1 / 31 Experimental Design To this point in the semester, we have largely focused on methods to analyze the data that we have with little regard to the decisions on how to gather the data.
Tags:
Information
Domain:
Source:
Link to this page:
Documents from same domain
Solutions to Homework 5 Statistics 302 Professor Larget
pages.stat.wisc.eduSolutions to Homework 5 Statistics 302 Professor Larget Textbook Exercises 4.79 Divorce Opinions and Gender In Data 4.4 on page 227, we introduce the results of a May 2010 Gallup poll of 1029 US adults. When asked if they view divorce as \morally acceptable", 71% of the men and 67% of the women in the sample responded yes. In the test for a di ...
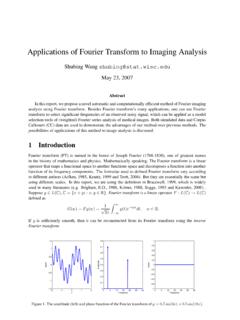
Applications of Fourier Transform to Imaging Analysis
pages.stat.wisc.eduCallosum (CC) data are used to demonstrate the advantages of our method over previous methods. The possibilities of applications of this method to image analysis is discussed. 1 Introduction Fourier transform (FT) is named in the honor of Joseph Fourier (1768-1830), one of greatest names in the history of mathematics and physics.
Solutions to Homework 1 Statistics 302 Professor Larget
pages.stat.wisc.eduselected. Other options are possible: for example, we could number the plants from 1 to 30000 and randomly select 30 numbers between 1 and 30000. (b) Answers will vary for this question, but the procedure should be explained and the three numbers which were obtained should be listed. Here is the start of one sample. Row Plant #94 #180 #83 # 81 ...
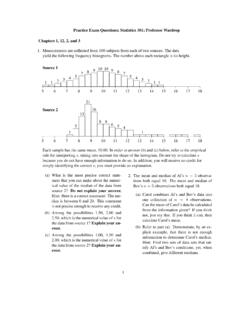
Practice Exam Questions; Statistics 301; Professor Wardrop
pages.stat.wisc.edu13. A sample space has three possible outcomes, B, C, and D. It is known that P(C) = P(D). The operation of the chance mechanism is simulated 10,000 times (runs). The sorted frequencies of the three outcomes (B, C, and D) are: 2322, 2360, and 5318. (a) What is your approximation of P(B)? To receive credit you must explain your an-swer.
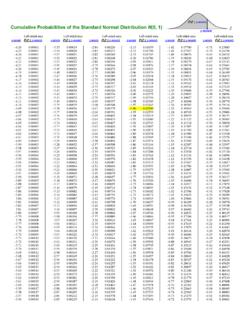
P(Z Cumulative Probabilities of the Standard …
pages.stat.wisc.eduCumulative Probabilities of the Standard Normal Distribution N(0, 1) Left-sided area Left-sided area Left-sided area Left-sided area Left-sided area Left-sided area
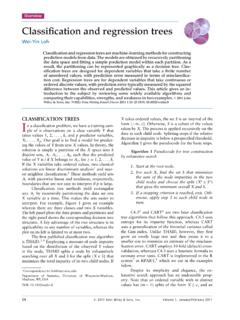
Classification and regression trees
pages.stat.wisc.eduOverview Classification and regression trees Wei-Yin Loh Classificationandregressiontreesaremachine-learningmethodsforconstructing predictionmodelsfromdata ...
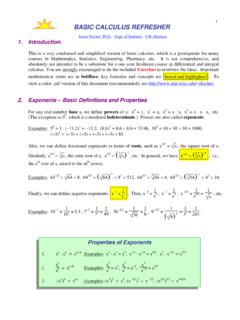
BASIC CALCULUS REFRESHER - pages.stat.wisc.edu
pages.stat.wisc.edu3 y = x y = x2 Notice that the line has the generic equation y = f (x) = mx + b, where b is the Y-intercept (in this example, b = +3), and m is the slope of the line (in this example, m = +2). In general, the slope of any line is defined as the ratio of “height change” y to “length change” x, that is, m = y
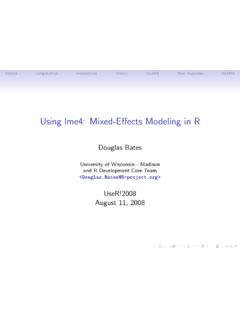
Using lme4: Mixed-Effects Modeling in R
pages.stat.wisc.eduDe nition of linear mixed-e ects models A mixed-e ects model incorporates two vector-valued random variables: the response, Y, and the random e ects, B. We observe the value, y, of Y. We do not observe the value of B. In a linear mixed-e ects model the conditional distribution, YjB, and the marginal distribution, B, are independent,

3. The Gaussian kernel
pages.stat.wisc.eduThe Gaussian kernel is defined in 1-D, 2D and N-D respectively as ... process of observation s can never become zero. For, this would imply making an observation through an infinitesimally small aperture, which is impossible. The factor of 2 in the exponent is a matter of convention,
CHAPTER 8. RANDOMIZED COMPLETE BLOCK DESIGN …
pages.stat.wisc.eduMSEB is the mean square of design-B with degrees of freedom dfB. If RE>1, design A is more efficient. If RE<1, the converse is true. If a randomized complete block design (say, design-A) is used, one may want to estimate the relative efficiency compared with a completely randomized design (say, design-B).
Related documents
Some Practical Guidelines for Effective Sample-Size ...
stat.uiowa.eduin biostatistics journals, concerning sample-size determination for specific tests. Also of interest are studies of the extent to which sample size is adequate or inadequate in published studies; see Freiman et al. (1986) and Thornley and Adams (1998). There is a growing amount of software for sample-size determination,
Sampling and Sample Size Determination
sbselearning.strathmore.eduSampling and Sample Size Determination . Terms •Sample •Population •Population element •Census . Why use a sample? •Cost •Speed •Accuracy •Destruction of test units . Steps •Definition of target population •Selection of a sampling frame (list) •Probability or Nonprobability sampling •Sampling Unit •Error
Experimental design and sample size determination
www.biostat.wisc.eduSample size determination 24. 13 Fundamental formula $ per sample $ available n= 25 Listen to the IACUC Too few animals → a total waste Too many animals → a partial waste 26. 14 Significance test • Compare the BP of 6 mice fed salt water to 6 mice fed plain water. • Δ = true difference in average BP (the treatment effect).
13 Determining the Sample Size - Department of Statistics
www.stat.columbia.eduA helpful tutorial on sample size issues is the paper by Steven Julious in Statistics in Medicine (Julious, 2004); a classic text is that of Desu and Raghavarao (1990). Nowadays, the use of specialist software for sample size determination such as NQuery, PASS or Power and Precision is common. We now consider the issues. 13.2 ISSUES
SAMPLING TECHNIQUES & DETERMINATION OF SAMPLE …
ijecm.co.ukpointed out that sample size determination is a difficult process to handle and requires the collaboration of a specialist who has good scientific knowledge in the art and practice of medical statistics. Techniques for estimating sample size and performing power analysis depend mainly on the design of the study and the main measure of the study.

Sample Size Guideline for Correlation Analysis
core.ac.ukmany sample need to be collected and why they planned for the estimated sample size. 2. Methodology Sample size for correlation was generated using Power Analysis and Sample Size Software (PASS) version 11.0. Sample size calculations were conducted for one correlation test and inequality tests for two correlations.
Test Procedures - NDDOT Home Page
www.dot.nd.govTest specimen shall be a representative sample based on the following table. Nominal Maximum Size Minimum Mass No. 4 (4.75 mm) or smaller 300 g 3/8" (9.5 mm) 1000 g 3/4" (19.0 mm) 2500 g 1½" (37.5 mm) 5000 g The sample size required for this test is a minimum after drying. PROCEDURE Record all information on SFN 9987 or SFN 2455.

METHOD OF TEST FOR SIEVE ANALYSIS OF FINE AND …
dot.ca.gov1. Sieve the entire test sample according to Section F. 2. Split or quarter a fine-aggregate test sample weighing 500 g ± 25 g from the material passing the No. 4 sieve. a. If there is insufficient material passing the No. 4 sieve to obtain the required 500 g ± 25 g, use all of the material passing the No. 4 sieve for the fine- aggregate test ...