Transcription of Extending Linear Regression: Weighted Least Squares ...
1 Extending Linear Regression: Weighted LeastSquares, Heteroskedasticity, Local PolynomialRegression36-350, Data Mining23 October 2009 Contents1 Weighted Least Squares12 Weighted Least Squares as a Solution to Heteroskedasticity ..53 Local Linear Regression104 Exercises151 Weighted Least SquaresInstead of minimizing the residual sum of Squares ,RSS( ) =n i=1(yi ~xi )2(1)we could minimize theweightedsum of Squares ,WSS( , ~w) =n i=1wi(yi ~xi )2(2)This includes ordinary Least Squares as the special case where all the weightswi= 1. We can solve it by the same kind of algebra we used to solve theordinary Linear Least Squares problem. But why would we want to solve it? Forthree may care very strongly about predicting the re-sponse for certain values of the input ones we expect to see often again,ones where mistakes are especially costly or embarrassing or painful, than others.
2 If we give the pointsxinear that region big weightswi,and points elsewhere smaller weights, the regression will be pulled towardsmatching the data in that Least Squares is the maximum likeli-hood estimate when the inY=~X + is IID Gaussian white means that the variance of has to be constant, and we measurethe regression curve with the same precision elsewhere. This situation, ofconstant noise variance, is calledhomoskedasticity. Often however themagnitude of the noise is not constant, and the data we have heteroskedasticity, even if each noise term is still Gaussian,ordinary Least Squares is no longer the maximum likelihood estimate, andso no longer efficient. If however we know the noise variance 2iat eachmeasurementi, and setwi= 1/ 2i, we get the heteroskedastic MLE, andrecover say the same thing slightly differently, there s just no way that we canestimate the regression function as accurately where the noise is large aswe can where the noise is small.
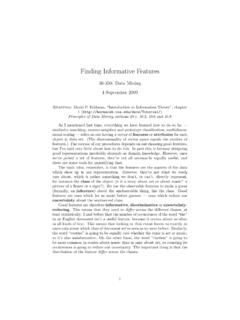
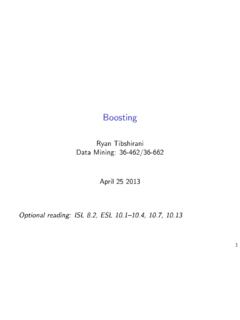
3 Trying to give equal attention to all partsof the input space is a waste of time; we should be more concerned aboutfitting well where the noise is small, and expect to fit poorly where thenoise is something are a number of other optimization prob-lems which can be transformed into, or approximated by, Weighted leastsquares. The most important of these arises from generalized Linear mod-els, where the mean response is some nonlinear function of a Linear pre-dictor. (Logistic regression is an example.)In the first case, we decide on the weights to reflect our priorities. In thethird case, the weights come from the optimization problem we d really ratherbe solving. What about the second case, of heteroskedasticity?2-4-2024-15-10-505101 5xyFigure 1: Black line: Linear response function (y= 3 2x).
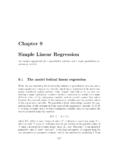
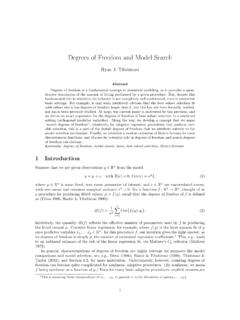
4 Grey curve:standard deviation as a function ofx( (x) = 1 +x2/2).2 HeteroskedasticitySuppose the noise variance is itself variable. For example, the figure shows asimple Linear relationship between the inputXand the responseY, but also anonlinear relationship betweenXand Var [Y].In this particular case, the ordinary Least Squares estimate of the regressionline is , with R reporting standard errors in the coefficients of , respectively. Those are however calculated under the assumption thatthe noise is homoskedastic, which it isn t. And in fact we can see, pretty much,that there is heteroskedasticity if looking at the scatter-plot didn t convinceus, we could always plot the residuals againstx, which we should do see whether that makes a difference, let s re-do this many times with3-6-4-20246-20-10010xyx = rnorm(100,0,3)y = 3-2*x + rnorm(100,0,sapply(x,function(x){1+ *x^2}))plot(x,y)abline(a=3,b=-2,col="gre y") = lm(y~x)abline( $coefficients,lty=2)Figure 2: Scatter-plot ofn= 100 data points from the above model.
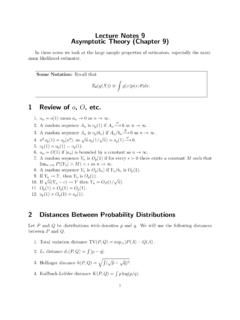
5 (HereX N(0,9).) Grey line: True regression line. Dashed line: ordinary leastsquares regression residualsFigure 3: Residuals (left) and squared residuals (right) of the ordinary leastsquares regression as a function ofx. Note the much greater range of theresiduals at large absolute values ofxthan towards the center; this changingdispersion is a sign of heteroskedasticity. The plot on the left was made withplot(x, $residuals), and similarly for the draws from the same model (Example 1). (100)produces 104random sam-ples which all have the samexvalues as the first one, but different values ofy, generated however from the same model. It then uses those samples to getthe standard error of the ordinary Least Squares estimates. (Bias remains anon-issue.)
6 What we find is the standard error of the intercept is only a littleinflated (simulation value of versus official value of ), but the standarderror of the slope is much larger than what R reports, versus Sincethe intercept is fixed by the need to make the regression line go through thecenter of the data, the real issue here is that our estimate of the slope is muchless precise than ordinary Least Squares makes it out to be. Our estimate is stillconsistent, but not as good as it was when things were homoskedastic. Can weget back some of that efficiency? Weighted Least Squares as a Solution to Heteroskedas-ticitySuppose we visit the Oracle of Regression (Figure 4), who tells us that thenoise has a standard deviation that goes as 1 +x2/2. We can then use this toimprove our regression, by solving the Weighted Least Squares problem ratherthan ordinary Least Squares (Figure 5).
7 This not only looks better, it is better: the estimated line is now , with reported standard errors of and Does this check out withsimulation? (Example 2.) = function(n) {y = 3-2*x + rnorm(n,0,sapply(x,function(x){1+ *x^2})) = lm(y~x)# Return the errorsreturn( $coefficients - c(3,-2))} = function(n,m=10000) { = t(replicate(m, (n)))# transpose gives us a matrix with named = sd( [,"(Intercept)"]) = sd( [,"x"])return(list( , ))}Code Example 1:Functions to generate heteroskedastic data and fit OLSregression to it, and to collect error statistics on the 4: Statistician (right) consulting the Oracle of Regression (left) aboutthe proper weights to use to overcome heteroskedasticity.(Image ) = lm(y~x, weights=1/(1+ *x^2))abline( $coefficients,lty=3)Figure 5: Figure 2, with addition of Weighted Least Squares regression line (dot-ted).
8 = function(n) {y = 3-2*x + rnorm(n,0,sapply(x,function(x){1+ *x^2})) = lm(y~x,weights=1/(1+ *x^2))# Return the errorsreturn( $coefficients - c(3,-2))} = function(n,m=10000) { = t(replicate(m, (n)))# transpose gives us a matrix with named = sd( [,"(Intercept)"]) = sd( [,"x"])return(list( , ))}Code Example 2: Linear regression of heteroskedastic data, using weightedleast-squared standard errors from the simulation are for the intercept and the slope, so R s internal calculations are working very of this was possible because the Oracle told us what the variance functionwas. What do we do when the Oracle is not available (Figure 6)?Under some situations we can work things out for ourselves, without needingan oracle. We know, empirically, the precision of our measurement of the responsevariable we know how precise our instruments are, or each value of theresponse is really an average of several measurements so we can use theirstandard deviations, etc.
9 We know how the noise in the response must depend on the input example, when taking polls or surveys, the variance of the proportionswe find should be inversely proportional to the sample size. So we canmake the weights proportional to the sample of these outs rely on kinds of background knowledge which are easier toget in the natural or even the social sciences than in data mining , there are approaches for other situations which try to use the observedresiduals to get estimates of the heteroskedasticity. This can then go into aweighted regression, and so forth; let me just sketch the idea for how to get thevariance function in the first Estimater(x) with your favorite regression method, getting r(x).2. Construct thelog squared residuals,zi= log (yi r(xi))2).
10 1 This is ripped off from Wasserman (2006, pp. 87 88).8 Figure 6: The Oracle may be out (left), or too creepy to go visit (right). Whatthen?(Left, the sacred oak of the Oracle of Dodona, copyright 2006 by Flickr user essayen , ; right, the entrace to the cave of the Sibyl of Cum , copyright 2005 by Flickr user pverdicchio , Both used under Creative Commons license.)3. Use your favoritenon-parametricmethod to estimate the conditional meanof thezi, call it q(x).4. Predict using 2x= exp q(x).The quantityyi r(xi) is theithresidual. If r r, then the residuals shouldhave mean zero. Consequently the variance of the residuals (which is what wewant) should equal the expected squared residual. So squaring the residualsmakes sense, but why the log? Basically, this is a convenience Squares arenecessarily non-negative numbers, but lots of regression methods don t easilyinclude constraints like that, and we really don t want to predict negative the log gives us an unbounded range for the regression.