Transcription of FEATURES SHOWN ON TOPOGRAPHIC MAPS - USGS
1 GEOLOGICAL SURVEY CIRCULAR 368 FEATURES SHOWN ON TOPOGRAPHIC MAPS UNITED STATES DEPARTMENT OF THE INTERIOR Douglas McKay, Secretary GEOLOGICAL SURVEY W. E. Wrather, Director GEOLOGICAL SURVEY CIRCULAR 368 FEATURES SHOWN ON TOPOGRAPHIC MAPS By John B. Rowland Washington, D. C., 1955 Free on application to the Geological Survey, Washington 25, D. C. GEOLOGICAL SURVEY TOPOGRAPHIC INSTRUCTIONS Chapter 1 B 3 FEATURES SHOWN ON TOPOGRAPHIC MAPS Contents Abstract .. Principles of map representation 1. Definition of a n1ap a. TOPOGRAPHIC map .. b. Planimetric map .. 2. Elements of map construction . a. Colors and classes of FEATURES .. b. Lines and symbols .. c. Letters and numbers .. d. Map scale .. Problem of selecting FEATURES . 4. Selecting map FEATURES for a purpose 5. Other factors in selecting map Page 5 5 5 5 5 5 5 6 6 6 6 6 FEATURES .. 7 a. Legibility .. 7 b. Cost of production.
2 8 c. Obsolescence .. 8 d. Concept of a landmark 8 Map delineation of TOPOGRAPHIC relief 8 6. Methods and objectives 8 a. Measurement .. 9 b. Interpretation .. 9 7. Selection in mapping relief FEATURES . 9 a. Choosing a contour interval 9 b. Generalization .. 10 8. TOPOGRAPHIC expression 10 9. Kinds of relief FEATURES 10 a. Erosional FEATURES .. b. Residual FEATURES .. c. Depositional FEATURES .. 10. Symbols and patterns used to show relief .. 10 12 12 12 a. Hachures .. 12 b. Area patterns .. 12 c. Relief shading.. 15 Map representation of water FEATURES . 15 11. Periodic changes in water FEATURES . 15 a. Classification of water FEATURES . 16 b. "Normal" water level .. 16 Page Map representation of water FEATURES --Continued 12. Kinds of water FEATURES and map symbols .. 16 a. Linear watercourses .. 16 b. Area water FEATURES .. 17 c. Glaciers and permanent snow-fields .. d. Springs and wells.
3 E. Coastal FEATURES . Manmade map FEATURES .. 13. Coordinate systems, subdivisions, and boundaries .. a. Coordinate systems b. Public-land subdivisions c. Boundaries .. 14. Travel and transportation routes . a. Roads and trails .. b. Railroads .. c. Other route FEATURES 15. Buildings and cities .. a. B11ildings .. b. Building groups .. c. Towns and cities 16. Names, notes, and numbers a. Map names .. b. Geodetic control marks . c. Spot elevations .. Information on map margins .. 17. Identification, orientation, and explanation .. a. Identification .. b. Responsibility, methods, and dates .. c. Scale, contour interval, and other data .. Map references .. 18. Special selected list . 19. Other reference maps 17 17 17 18 18 18 18 19 19 19 19 19 19 19 20 20 20 20 20 21 21 21 21 21 21 22 22 23 3 Figure 1. 2. 3. 4. 5. 6. 7. 8. 9. 10. Pictographic map symbols Comparison of map scales Illustrations Contours.
4 Two maps of identical areas in southeast New York State . Con toured slopes .. Drumlins in northern New York .. Cedar Creek alluvial fan in Montana . Depression contours and hachures .. Hydrographic FEATURES .. Information SHOWN in center of lower margin. TOPOGRAPHIC map symbols .. 4 Page 6 7 9 11 13 14 15 16 17 22 facing page 22 Chapter 1 B 3 1 FEATURES SHOWN ON TOPOGRAPHIC MAPS ABSTRACT TOPOGRAPHIC maps represent FEATURES on the earth's surface by means of symbols and labels; separate colors distinguish the main classes of map FEATURES . The amount of information SHOWN on a TOPOGRAPHIC map depends on the map scale, the purpose of the map, and the cost of obtain-ing the information. This chapter describes the three main categories of map information and the methods by which they are SHOWN . Reference lists of published maps and a chart illustrating standard map symbols are included.
5 PRINCIPLES OF MAP REPRESENTATION 1. Definition of a map A map is a graphical representation, at an established scale, of a part of the earth's sur-face, showing important natural and manmade FEATURES in their correct positions relative to a coordinate reference system and to each other. a. TOPOGRAPHIC map. --A TOPOGRAPHIC map, as distinguished from other kinds, portrays by some means the shape and elevation of the ter-rain. Geological Survey TOPOGRAPHIC maps usu-ally represent elevations and laNdforms--the shapes into which the earth's surface is sculp-tured by natural forces--by contour lines. Other FEATURES are SHOWN by a variety of conventional signs, symbols, lines, and patterns, which are printed in appropriate colors and identified by names, labels, and numbers. The chart facing page 22 shows the standard symbols used on the TOPOGRAPHIC maps of the Survey. b. Planimetric map.
6 --A planimetric map is similar to a TOPOGRAPHIC map, except that it does not portray relief in a measurable form. The Survey publishes some planimetric maps for use until they can be replaced by TOPOGRAPHIC maps. 1 The number 1 B 3 signifies Book 1, Part B, Chapter 3 of the Geological Survey looseleaf manual of TOPOGRAPHIC Instructions. For a table of contents, see Chapter 1 A 2 (Circular 92). 2. Elements of map construction A TOPOGRAPHIC quadrangle map is the prod-uct of both engineering and the graphic arts. Surveys made on the ground and from photographs are organized in a coherent form and reproduced graphically according to a plan. To be useful the map must present information legibly. The graphic accuracy must be consistent with the accuracy of the source surveys and with the pub-lication scale. The map must include the infor-mation essential to its purpose and must exclude nonessentials.
7 The main -elements of quadrangle map construction have been formulated to attain these objectives. a. Colors and classes of FEATURES . --The information SHOWN on the quadrangle map is divided into three general classes, each printed in a different color. Information about the shape of the land surface--hypsographic or TOPOGRAPHIC information--is printe'd in brown. Water fea-tures--hydrographic information--are SHOWN in blue. Cultural FEATURES --manmade objects --are SHOWN in black. The system of division is not precise. Some manmade FEATURES --for ex-ample, levees and earth dams--are also topo-graphic FEATURES and are printed in brown, not black. 5 6 (Ch. 1 B 3) TOPOGRAPIDC INSTRUCTIONS Besides the colors used for the three main classes of FEATURES , green is used to show wood-land--timber, brush, vineyards, and orchards--and red is used to show public-land subdivisions (cultural FEATURES ) and the classification of the more important roads.
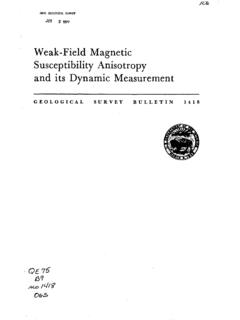
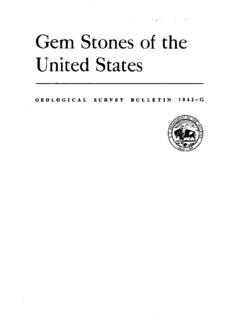
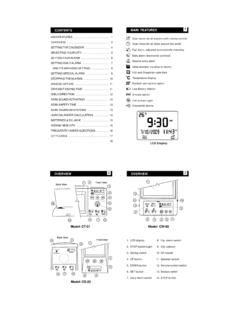
8 B. Lines and symbols. --Linear FEATURES are represented by lines of various weights and styles (solid, dashed, dotted, or some combina-tions). Structures, or individual FEATURES , are portrayed by a system of pictographs or symbols. The symbols originated as plan views of the ob-jects they represent, and they retain something of this character although they are now formal-ized. The building symbol, for example, is a solid or open square. The railroad symbol is a line with evenly spaced cross ties. The dam and levee symbols look approximately like dams or levees as seen from the air. (See fig. 1. ) D j ( ////I I\\\'\.'\ II BUILDINGS DAM / .. "''"''' ,,,,'' ,,,,,,, ~' ,,,, ,, ' , RAILROAD LEVEE Figure 1. --Pictographic map symbols. c. Letters and numbers. --Because lines and symbols cannot represent map information completely, they must be supplemented by the names of places and objects.)
9 Notes must be added to explain some FEATURES that cannot be depicted clearly by symbols alone. In mapping TOPOGRAPHIC FEATURES the information portrayed by contour lines must be supplemented by eleva-tion figures. Letters and numbers are essen-tial to map interpretation, but they tend to ob-scure other map information. Therefore, they must be selected and positioned carefully on the map so that interference with other detail is kept to a minimum. d. Map scale. --Map scale is the relation-ship of the size of the map to the size of the ground area it represents. The relationship may be expressed as a linear equivalent, such as 1 inch equals 1 mile--meaning that 1 inch measured on the map represents 1 mile on the ground--or it may be expressed in many other ways. The scale of Survey maps is given in the form of a ratio or fraction, without dimensions; the numerator is the distance on the map, and the denominator is the corresponding distance on the ground.
10 For example, 1:24,000 means that one unit of length on the map represents 24,000 similar units on the ground. 3. Problem of selecting FEATURES The amount of information that can be de-picted legibly on a map is limited by the scale of the map. The effect of scale on map content is emphasized if the scale is considered as a ratio of areas rather than a ratio of distances. Figure 2 illustrates the actual paper areas rep-resenting 1 square mile at 2 standard scales for TOPOGRAPHIC mapping. The major problem in map compilation is to make the best use of the available map space. The space cannot be crowded with lines and symbols beyond a definite limit without making the map unreadable, yet the amount of informa-tion that might be useful or desirable is almost unlimited. The cartographer must select the FEATURES that are the most valuable to the map user. The smaller the map scale, the more critical and difficult the problem of selection becomes.