Transcription of Fiscal Year 2017 Operational Expenditure Plan
1 Fiscal year 2017 Operational Expenditure Plan July 1, 2016 to June 30, 2017 Introduction and Overview Leeward Community College s annual Operational Expenditure Plan (OEP) reflects revenue and Expenditure estimates available to meet the College s current operations and to fund the basic instructional and support mission of the institution. For Fiscal year (FY) 2017 , the College s operating budget is $38,548,509. The funding available to the College comes from a variety of sources, each with its own statutes, regulations, policies, and procedures that govern the budget preparation and budget execution processes.
2 Four of these funding categories are the primary sources of revenue used to support the College s operating budget or OEP and include the following: General Funds ( G Funds): funds that are derived from the general revenues of the State and appropriated by the Legislature. Special allocations from the UH and UHCC system offices are also included in this category of funds and include such items as enrollment growth and performance measure funding. This category of funding accounts for the majority of revenues in the OEP and is primarily used to fund salaries for faculty and staff. Tuition and Fees Special Fund (TFSF): funds included in this category include the tuition funds received from the credit-generating programs of the institution and also include special allocations related to enrollment growth, performance funding, and allocations related to UHCC strategic initiatives.
3 These funds are used to support the Operational expenses for academic and support units of the College and to also fund salaries and wages for faculty, staff, and students. Community College Special Fund (CCSF): funds in this category are derived from an institutional assessment of the gross revenues generated by fees and services across accounts that fall under the CCSF designation. CCSF accounts include such items as Summer Session, OCEWD programs, transcript fees, library fines, and food service and vending related accounts, among others. Research and Training Revolving Funds (RTRF): includes indirect cost recovery revenues received from extramural grants and contracts.
4 Funds are distributed centrally to the College by the UH Office of Research Services (ORS) on an annual basis. The following informational displays are contained within this document and provide table and graphical representations of the operating budget and related information. Display 1: Operating Budget by Source of Funds Display 2: FY 2017 Collective Bargaining Unit Salary Adjustments Display 3: Student Headcount Enrollment Display 4: Student Semester Hours (SSH) Display 5: Tuition and Fee Rates for 2016- 2017 Display 6: FY 2017 Operating Budget by Program Display 7: FY 2017 Operational Expenditure Plan Display 8: FY 2017 Reallocations and New Funding Recommendations Display 9: FY 2017 Operational Expenditure Plan Summary by Program Display 10: FY 2017 Tuition and Fee Special Fund Allocations Display 11: Personnel Planning List Display 12.
5 Non-Personnel Planning List Operating Budget Highlights for FY 2017 I. Summary Leeward Community College s operating budget for FY 2017 is $38,548,509. This represents an increase of $2,799,624 or over the previous year s budget. Increases in the General Fund are attributable to various collective bargaining salary adjustments for employees that were funded by the state legislature and additional funds allocated to the College for reaching or exceeding all performance measures set by the UH and UHCC system offices. The growth in the Tuition and Fee Special Fund is largely due to a 5% increase in tuition and fee rates for resident students and a tuition increase for non-resident students moderated by a slight decline in student enrollment.
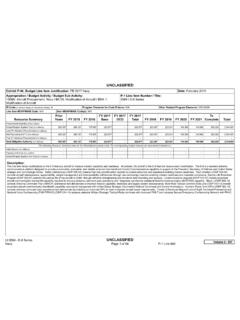
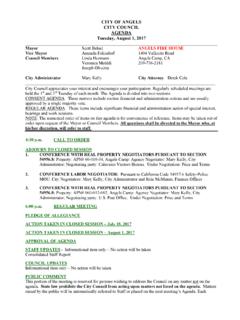
6 Changes in the Community College Special Fund reflect a decline due to gross revenues earned by various funds most notably in the Cafeteria (summer closing), ticket sales from theatrical performances (reduced schedule due to facility renovation), and in Summer Session enrollment. A decline in the Research and Training Revolving Fund budget reflects a reduction indirect cost recovery revenue earned by the College as several contracts and grants have ended. Display #1 Operating Budget by Source of Funds Funding Source FY 2017 FY 2016 $ Change % Change. General Fund $22,554,390 $19,783,700 $2,770,690 Tuition & Fee Special Fund 15,593,719 15,338,484 255,235 Community College Special Fund 300,400 411,000 -110,600 Research & Training Revolving Fund 100,000 215,701 -115,701 Totals $38,548,509 $35,748,885 $2,799,624 $22,554, $15,593, $300, $100, Budget by Source of FundsGeneral FundTuitionCC Special FundRsrch & Trng FundII.
7 Collective Bargaining Unit Salary Adjustments The operating budget and financial plan for the institution contains financial resource provisions necessary to fund the collective bargaining salary adjustments for all faculty and staff employees. Display #2 identifies the various salary adjustments by bargaining unit. Display #2 FY 2017 Collective Bargaining Unit Salary Adjustments Bargaining Unit Bargaining Unit Adjustment Effective Date 01-Blue-Collar, Non-Supervisory 2% 2% October 1, 2016 April 1, 2017 02-Blue-Collar, Supervisors 2% 2% October 1, 2016 April 1, 2017 03-White-Collar, Non-Supervisory Step Movements Various January 1, 2017 04-White-Collar, Supervisors Step Movements Various January 1, 2017 07-Faculty 4% July 1, 2016 08-Administrative, Professional, Technical (APT) 4% July 1, 2016 Executive/Managerial $2,000 Across the Board + Performance Adjustments July 1, 2016 III.
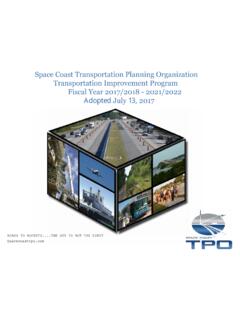
8 Enrollment Student enrollment levels, as measured by headcount enrollments and the number of student semester hours (SSH) generated by tuition fee-paying students, are projected to slightly decline as compared to the enrollment levels of the previous year . The tuition and fee revenue projections used for the FY 2017 budget reflects this change. The declining enrollment projection is anticipated to be short-term in nature as continued and sustained long-term growth in the business and housing sectors of the College s service area is expected. Display #3 Student Headcount Enrollment Display #4 Student Semester Hours 2005-062006-072007-082008-092009-102010- 112011-122012-132013-142014-152015-16 Fall5,7095,7465,8876,7717,4847,9427,8957 ,9607,9767,7427,535 Spring5,2695,2725,7466,2587,0037,1777,24 97,2177,1766,8566,9534,0004,5005,0005,50 06,0006,5007,0007,5008,0008,500 Student Headcount Enrollment-Credit Students -2005-062006-072007-082008-092009-102010 -112011-122012-132013-142014-152015-16 Fall49,97649,98651,99158,43865,12168,295 67,82068,78468,13667,16365,606 Spring44,76545,34348,75953,57159,80360,1 4360,85161,55260,03258,21857,88940,00050 ,00060,00070,00080.
9 000 Student Semester Hours (SSH)-Credit Students -IV. Tuition and Fee Rate Increases The tuition and fee rates for the 2016-17 academic year were approved by the University of Hawaii Board of Regents (BOR) on May 21, 2015. The BOR agreed to increase Resident tuition by $ per credit, or , to a total of $ per credit. Non-resident tuition was increased by $ per credit, or , to a total of $ per credit. No other mandatory student fee increases were proposed or approved for the 2016-17 academic year . Display #5 Tuition and Fee Rates for 2016-17 2016-17 2015-16 $ Change % Change Resident Tuition: Per Credit $ $ $ Non-Resident Tuition : Per Credit $ $ $ Student Activities Fee: Per Credit Per Semester Maximum $ $ $ $ $ $ Board of Student Communication Fee: Per Semester $ $ $ Student Health Fee: Per Semester $ $ $ Operational Expenditure Plan Details The details of the FY 2017 Operational Expenditure Plan (OEP) is presented on the next several pages.
10 Due to the fluidity of the budget, especially with regards to tuition revenue estimates, enrollment forecast changes, unanticipated Expenditure outlays, and unfunded mandates, reviews and analyses of the overall health of the budget are performed on a regular basis throughout the year . Several detail reports accompany the revenue and expense summary (Display 7) and provide further insight into the composition of the budget. Display 8 FY 2017 Reallocations and New Funding Recommendations highlights the final new funding decisions made by the campus administration. The items that are included in the final funding decisions were all high-priority recommendations that originated through the College s Annual Report of Program Data (ARPD) planning process or were fixed cost or mandatory funding items.