Transcription of FOREWORD - acea.auto
1 SUMMARY. EMPLOYMENT 6. PRODUCTION 11. REGISTRATIONS 20. TRADE 31. VEHICLES IN USE 42. ROAD SAFETY 47. ENVIRONMENT 52. INNOVATION 59. TAXATION 64. ABOUT ACEA 71. FOREWORD . EVERY YEAR, the european automobile Manufacturers' Association (ACEA) publishes this Pocket Guide in order to provide a clear and comprehensive overview of one of Europe's most strategic and innovative sectors: the auto industry. Updated with the latest data on employment, vehicle production and sales, trade flows, the vehicle fleet, road safety, the environment, innovation and taxation, this is the reference guide for anyone interested in automotive issues and related EU policies. You will surely notice that the 2021-2022 edition is rather special, as our landmark publication got a complete overhaul in line with ACEA's new visual identity. On a less positive note, the facts and figures in this Pocket Guide also reveal the dramatic impact of COVID-19 on Europe's auto industry.
2 Almost 13 million motor vehicles were made in the EU in 2020, representing of global production, but down 5 million units compared to 2019. Car output plummeted by during the crisis year, while EU commercial vehicle production took a 21% hit. Exports of EU-built vehicles also decreased by nearly 15% in 2020, although still generating a billion trade surplus for the european Union. Despite this unprecedented downturn, these statistics also demonstrate the continued importance of the industry as an economic powerhouse that literally keeps Europe on the move, regardless of what happens. 3. As we work towards a new era of mobility and a carbon-neutral Europe, innovation remains at the core of our sector's DNA. With some million people directly and indirectly involved in the production of vehicles across the EU, the auto industry accounts for of all manufacturing jobs in the region.
3 Looking at the entire automotive ecosystem, the sector provides work to million Europeans, or of the EU's total workforce. Apart from ensuring that people and goods can continue to move freely throughout Europe, the 278 million vehicles on our roads are also a major source of government income, annually generating billion in taxes for 14 major EU markets alone. And as we work towards a new era of mobility and a carbon-neutral Europe, innovation remains at the core of our sector's DNA. Investing an impressive 62 billion per year, and responsible for a whopping 33% of total EU. spending on innovation, the automotive sector has really solidified its position as Europe's number one investor in R&D. More than ever, we are ready and committed to provide solutions for the challenges of tomorrow. Eric-Mark Huitema ACEA Director General 4.
4 KEY FIGURES. EMPLOYMENT. Manufacture of motor vehicles (EU) million people = of EU employment in manufacturing 2018. Total (EU manufacturing, services and construction) million people = of total EU employment 2018. PRODUCTION. Motor vehicles (world) million units 2020. Motor vehicles (EU) million units = of global motor vehicle production 2020. Passenger cars (world) million units 2020. Passenger cars (EU) million units = of global passenger car production 2020. REGISTRATIONS. Motor vehicles (world) million units 2020. Motor vehicles (EU) million units = of global motor vehicle registrations 2020. Passenger cars (world) million units 2020. Passenger cars (EU) million units = of global passenger car registrations 2020. Petrol (EU) market share 2020. Diesel (EU) 28% market share 2020. Electrically-chargeable cars (EU) market share 2020.
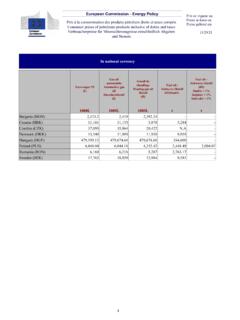
5 Electrically-chargeable vans (EU) market share 2020. Electrically-chargeable trucks (EU) market share 2020. Electrically-chargeable buses (EU) market share 2020. TRADE. Motor vehicle exports (extra-EU) billion 2020. Motor vehicle imports (extra-EU) billion 2020. Trade balance (extra-EU) billion 2020. VEHICLES IN USE. Motor vehicles (EU) million units 2019. Passenger cars (EU) million units 2019. Motorisation rate (EU) 628 vehicles per 1,000 inhabitants 2019. Average age of cars (EU) years 2019. Average age of vans (EU) years 2019. Average age of trucks (EU) years 2019. Average age of buses (EU) years 2019. ROAD SAFETY. Road fatalities per million inhabitants (EU) 51 people 2019. ENVIRONMENT. Average CO2 emissions (EU) CO2/km 2020. INNOVATION. Automotive R&D investment (EU) billion 2019. TAXATION. Fiscal income from motor vehicles (EU14) billion 2020.
6 5. EU AUTOMOTIVE SECTOR: DIRECT AND INDIRECT EMPLOYMENT In thousands / 2018. DIRECT MANUFACTURING 2,571. direct jobs m jobs Motor vehicles 1,120. m Bodies (coachwork), trailers and semi-trailers 158. m manufacturing jobs Parts and accessories 1,293. INDIRECT MANUFACTURING 909. Rubber tyres and tubes, retreading and rebuilding of rubber tyres 122. m jobs Computers and peripheral equipment 60. Electric motors, generators and transformers 245. Bearings, gears, gearing and driving elements 232. Cooling and ventilation equipment 249. m jobs m manufacturing jobs automobile USE 3,948. Sale of motor vehicles 1,411 m jobs Maintenance and repair of motor vehicles 1,323. m non-manufacturing jobs Sale of motor vehicle parts and accessories 641. Retail sale of automotive fuel in specialised stores 404. Renting and leasing of motor vehicles 168.
7 TRANSPORT 4,483. m jobs Other passenger land transport 1,393. Freight transport by road 3,090. CONSTRUCTION 666. m jobs SOURCE: EUROSTAT. Roads and motorways 629. Bridges and tunnels 37. The auto industry provides direct and indirect jobs for million Europeans 7. EMPLOYMENT IN THE EU AUTOMOTIVE SECTOR In million jobs / 2014 2018. Direct manufacturing Indirect manufacturing automobile use Transport Construction + 14 + + + 12. 10. 8. 6. 4. SOURCE: EUROSTAT. 2. 0. 2014 2015 2016 2017 2018. EU automotive % change employment 2014 2015 2016 2017 2018 18/17. Direct manufacturing 2,211,571 2,282,219 2,325,011 2,440,720 2,571,359 + Indirect manufacturing 769,086 829,749 823,201 878,774 908,747 + automobile use 3,657,867 3,668,769 3,789,494 3,888,807 3,947,518 + Transport 3,826,799 3,715,235 4,136,627 4,341,044 4,483,090 + SOURCE: EUROSTAT.
8 Construction 487,741 610,684 578,368 633,423 665,863 + TOTAL 10,953,064 11,106,656 11,652,701 12,182,768 12,576,577 + The automotive sector accounts for of all EU jobs 8. MANUFACTURING JOBS IN THE EU AUTO SECTOR % share / 2018. Direct automotive Automotive manufacturing manufacturing m employment employment Indirect automotive manufacturing m employment Non-automotive SOURCE: EUROSTAT. manufacturing employment Direct automotive million people manufacturing employment = of EU employment in manufacturing Direct & indirect automotive million people manufacturing employment = of EU employment in manufacturing Total automotive employment million people (manufacturing, services and construction) = of total EU employment million people SOURCE: EUROSTAT. EU employment in the manufacturing sector = of total EU employment EU total employment1 190 million people 1.
9 Total employment from 20 to 64 years of EU manufacturing employment is in the automotive sector 9. EU DIRECT AUTOMOTIVE EMPLOYMENT Share of total manufacturing, by country / 2018. Romania Slovakia Sweden Czech Republic Hungary Germany european UNION Spain France Poland Slovenia Portugal Belgium Austria Italy Bulgaria Netherlands Finland Lithuania Estonia Latvia Denmark SOURCE: EUROSTAT. Croatia Greece Cyprus 0 2% 4% 6% 8% 10% 12% 14% 16% 18%. By country / 2018. Austria 38,873 France 238,666 Malta 0. Belgium 29,749 Germany 919,002 Netherlands 25,162. Bulgaria 23,556 Greece 1,965 Poland 214,642. Croatia 2,910 Hungary 101,908 Portugal 43,553. Cyprus 85 Ireland 0 Romania 194,787. Czech Republic 181,487 Italy 177,908 Slovakia 80,963. Denmark 4,346 Latvia 2,316 Slovenia 15,889. Estonia 2,871 Lithuania 6,216 Spain 161,722. SOURCE: EUROSTAT.
10 Finland 10,207 Luxembourg 0 Sweden 92,576. european UNION 2,571,359. The EU automotive sector directly employs million people in manufacturing 10. WORLD VEHICLE PRODUCTION In million units, % share / 2005 2020. Greater China 1 Europe 2 North America Japan/Korea South Asia South America Middle East/Africa 30. 33%. 25 27%. 24%. 31%. 20 25%. 24%. 20%. 22%. 25%. 15 21%. 18% 15% 17%. 16%. 15%. 10. 9%. 9%. 9% 8%. SOURCE: IHS MARKIT. 5 7% 6%. 4% 3%. 3% 3%. 2% 2%. 2%. 0. 2005 2010 2015 2020. 1. Includes Hong Kong and Taiwan 2. Includes Turkey and CIS countries In thousand units / 2020. % change % share 2020 2019 20/ 19 2020. Europe 1 17,093 21,778 Greater China 2 25,584 26,150 Japan/Korea 11,393 13,322 Middle East/Africa 1,705 2,010 North America 13,486 16,971 South America 2,355 3,417 SOURCE: IHS MARKIT. South Asia 6,326 8,931 WORLD 77,942 92,578 1.