Transcription of Formula Chart – AP Microeconomics Unit 2 – …
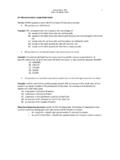
1 Formula Chart AP Microeconomics Unit 2 Supply and Demand Total revenue = price x quantity Coefficient of price elasticity of demand: % quantity demanded % price Coefficient > 1 = elastic demand Coefficient < 1 = inelastic demand Coefficient = 1 = unit elastic demand Coefficient = = perfectly elastic demand Coefficient = 0 = perfectly inelastic demand Cross elasticity of demand: comparing 2 items: % quantity of 1st item % price of 2nd item Cross elasticity coefficient positive = items substitute for each other Cross elasticity coefficient negative = items complement each other Income elasticity of demand: % quantity % income Income elasticity coefficient positive = normal good Income elasticity coefficient negative = inferior good Supply elasticity.
2 % quantity supplied % price Tax revenue = (Price w/tax price seller receives) x Quantity Unit 3 Production Markets revenue : Total revenue = price x quantity TR Q output .TR . Q output TR @ maximum when MR goes negative In perfect competition, MR = price (demand) for individual sellers In perfect competition, individual seller price = market price (price taker) In imperfect competition, MR < price (Demand) In imperfect competition, individual seller IS THE MARKET (price maker) Cost.
3 Total Cost = Total fixed cost + Total average cost Total Cost = unit cost x quantity output Average fixed cost = TFC Q output Average variable cost = TVC Q output Average total cost = TC Q output Average total cost = AFC + AVC marginal cost = TC Q output Product (aka output): Average product = Total product Q input marginal product = TP Q input TP @ maximum when MP goes negative In perfect competition market supply = individual seller cost curves or S = mc s Utility maximization rule marginal Utility of Good A marginal Utility of Good B Unit cost of A Unit
4 Cost of B = Average revenue = marginal revenue = Total revenue test P and TR then demand elastic P and TR then demand inelastic P and TR then demand elastic P and TR then demand inelastic Unit 3 Production Markets continued Profit: Profit maximization rule for all markets: marginal revenue = marginal Cost or MR = MC Total cost + total profit = total revenue also TR = Price x quantity Total cost = unit cost x quantity Total profit = unit profit x quantity Unit 4 Resource Markets marginal revenue product = TR Q of resource marginal resource cost = T resource C aka marginal factor cost Q of resource Profit maximization rule when purchasing a single resource.
5 marginal revenue Product = marginal Resource Cost or MRP = MRC In perfect competition market demand for labor = demand of all individual purchasers of labor or D = mrp s In perfect competition, MRP = product price x marginal product In imperfect competition, MRP = product price x marginal product MINUS price change on previous units sold In perfect competition, market wage = individual firms MRC (wage taker) In imperfect competition (monopsony), wage is MRP = MRC @ labor supply curve (wage maker) /MRC lies above S curve Unit 5 - Government Externalities: MSB = MSC Negative production externality (overallocation): Social cost > private cost Example: pollution Fix: taxes, regulations Positive production externality (underallocation): Social cost < private cost Example: technology Fix: subsidies, regulations Negative consumption externality (overallocation): Social benefit < private benefit Examples: cigarettes, alcohol, gambling Fix.
6 Taxes, regulations Positive consumption externality (underallocation): Social benefit > private benefit Examples: education, vaccines, smoke alarms Fix: taxes, subsidies or regulations Least Cost Rule marginal product of labor marginal product of capital Unit price of labor Unit price of capital = Profit maximization rule for purchasing multiple resources marginal product of labor marginal product of capital Unit price of labor Unit price of capital = = 1 Market Equilibrium MPC = MPB marginal Private
7 Cost = marginal Private Benefit