Transcription of Framing Your QbD Design Space with Tolerance …
1 Framing Your QbD Design Space with Tolerance Intervals to verify Specifications By Mark J. Anderson Given the push for Quality by Design (QbD) by the US FDA and equivalent agencies worldwide, statistical methods are becoming increasingly vital for pharmaceutical manufacturers. Design of experiments (DOE) is a primary tool because it provides a structured, organized method for determining the relationship between factors affecting a process and the response of that process. 1 QbD revolves around the concept of the Design Space , which is defined by the FDA as the multidimensional combination and interaction of input variables ( , material attributes) and process parameters that have demonstrated to provide assurance of quality. Working within the Design Space is not considered as a change. Movement out of the Design Space is considered to be a change and would normally initiate a regulatory post approval change process.
2 Design Space is proposed by the applicant and is subject to regulatory assessment and approval. 2 The FDA recommends that the Design Space be determined via a series of three methods: The first-principles approach, combining experimental data and mechanistic knowledge, is used to model and predict process performance. DOE is used to determine the impact of multiple factors and their interaction. Finally scale-up correlation is used to translate operating conditions between different scales or types of equipment. Compared to the traditional one-factor-at-a-time (OFAT) method, DOE drastically reduces the number of runs required to determine the desirable settings. There are many different types of designs, each of which offers advantages for certain applications. My preceding article3 focused on mixture experiments because of their usefulness for pharmaceutical formulation. At this stage the use of confidence intervals (CI) were introduced as a refinement for Framing QbD Design Space for functional development finding a recipe that on average should meet all the needs.
3 Now I will transition to a response surface method (RSM) Design for process optimization. This is the time to impose more conservative Tolerance intervals (TI) for verifying that the Design Space will be robust for meeting the manufacturing specifications on every individual unit, not just on average. Establishing a QbD Design Space that falls within Tolerance intervals Ultimately the FDA and other regulators want assurance that all, or nearly all, individual units (not just on average!) will meet specification . Then the objective is to define a processing window that provides a high level of confidence, say 95%, that 99% (a generally acceptable threshold) of the population meet (or exceed) specifications. Here s the approach taken for the statistical niceties: Via empirical DOE model the responses as functions of the process factors and then Apply a Tolerance interval to back off (provide a buffer) from the specifications.
4 What most engineers and their managers will not appreciate is that a relatively large experiment will be required to create any Design Space meeting such a rigorous statistical requirement. Thus, it is vital to estimate the number of runs before embarking on the experiment. The following case study illustrates how response surface methods (RSM) and Tolerance intervals can be used to set an operating window where specifications are consistently met. In the process we show how to assess whether the planned experiment will produce the hoped-for result a QbD Design Space that satisfies the regulatory authorities. In this case an optimal RSM Design (quadratic) is run with a tableting process on two vital factors: A. Granulation time: 3-7 minutes B. Lubrification time: 2-8 minutes The total of these two times must not exceed the range of 7 to 12 minutes a multifactor constraint. Three critical responses must all meet their final-product specifications: 1.
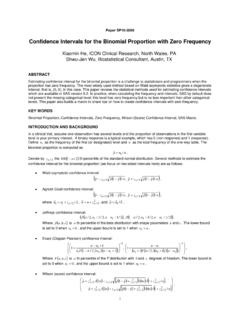
5 Dissolution 75% 2. Friability 3. Hardness 10 kP Table 1 displays the 23-run Design (produced in a statistically-optimal fashion with aid of a DOE-dedicated computer program4) and the experimental results. The fitted polynomials produce the predicted boundaries overlaid in Figure 1 (a graphical optimization plot). It exhibits a broad operating window. However, if the tableting process is operated on a boundary, then 50% (half!) of tablets produced fall outside the specification . To develop greater confidence that individual units fall within specifications, manufacturers must back off from the boundary by the Tolerance interval (TI) specifically the half-width. Formulas and factors ( k2 ) for computing a TI can be found in standard texts,5 but in general it widens directly with confidence level and proportion of in- specification product. Thus, the more demanding one gets for confidence and/or the nearer to 100 percent the requirements reach, the smaller the QbD Design Space becomes all else equal.
6 In fact, we often see the Space covered up entirely by the TI due to the experiment being insufficient (too small) for this purpose. For example, consider the case at hand the RSM on tableting process relying on a Design created in the same fashion as the previous case (formulating a tablet), that is: 6 points for the two-factor quadratic model 5 lack of fit points 5 replicates. As detailed by the presentation upon which this article is based,6 this 16-run Design suffices for functional Design - Space determination based on a fraction of Design Space (FDS) However, to maintain this FDS for a Design Space framed by TI, the model points must be over-specified by more than double to 13, which is why the actual experiment required 23 runs (=13+5+5). It turns out that not only are Tolerance intervals much wider than confidence intervals in general (for single samples), but they expand a bit further in the context of multifactor Thus, much larger sample sizes are needed for TIs than CIs.
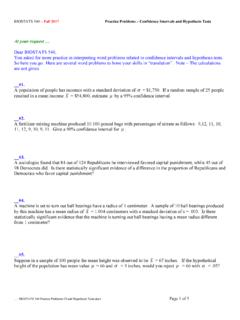
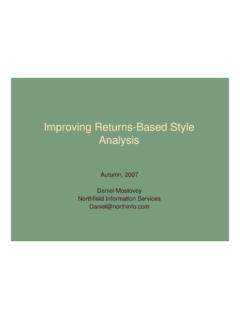
7 Table 2 quantifies the run increase in designs of more than 2 factors. Returning to our case study, see the TI-framed, QbD Design Space in Figure 2. Within this region, the two vital process factors can vary with little risk of producing off-grade product (based on specifying TIs at 95% confidence for 99% proportion). Summary In conclusion, a Quality by Design Design - Space determination maps out a region where in- specification product can be reliably manufactured. This requires allowance for uncertainty about the boundaries by buffering them with Tolerance intervals. As illustrated by Figure 3, the FDA allows engineers to create a control Space that floats inside the Design Space allowing for inevitable process drift from changing raw materials and other sources of natural variability. Engineers are advised to size their experiment appropriately for the purpose: For functional Design account for uncertainty in the form of confidence intervals (CI), which reduce the risk of mean results falling outside the allowable operating boundaries.
8 To verify that product falls within final manufacturing specifications impose Tolerance intervals (TI). Keep in mind that TIs range far wider than CIs. Therefore many more runs, often about half-again, will be required to accommodate TIs for the manufacturing Design Space . References 1. Guidance for Industry, Q8(R2) Pharmaceutical Development, Department of Health and Human Services, Food and Drug Administration (FDA), Center for Drug Evaluation and Research (CDER), Center for Biologics Evaluation and Research (CBER), November 2009, International Conference on Harmonisation of Technical Requirements for Registration of Pharmaceuticals for Human Use (ICH) Revision 2. 2. Ibid. 3. Anderson MJ, What to Look for in Statistical Software, Pharmaceutical Manufacturing (Pharma QbD), January 2011. 4. Design -Expert software, version 8, Stat-Ease, Inc., Minneapolis, MN. 5. Hahn GJ, Meeker WQ, Statistical Intervals; A Guide for Practitioners, John Wiley and Sons: New York, 1991.
9 6. Whitcomb PJ, Anderson MJ, Using DOE with Tolerance Intervals to verify Specifications, 11th annual meeting of the European Network for Business and Industrial Statistics (ENBIS), University of Coimbra (Portugal) September 4-8, 2011. 7. Whitcomb PJ, Sizing Mixture (RSM) Designs, American Society of Quality (ASQ) Chemical and Process Industries Division Website 8. Gryze SDE, Langhans I, Vandebroek M, Using the Intervals for Prediction: A Tutorial on Tolerance Intervals for Ordinary Least-Squares Regression , Chemometrics and Intelligent Laboratory Systems, 2007, 87:147 154. Tables and Figures Std Point Type A: Granu-lation B: Lubri- fication Disso-lution Fria-bilityHard-ness minutesminutes% % kP 1 Vertex 2 Vertex 3 Vertex 4 Vertex 5 Vertex 6 Vertex 7 Interior 8 Interior 9 Interior 10 Vertex 11 Vertex
10 12 Vertex 13 Interior 14 Interior 15 Vertex 16 Vertex 17 Vertex 18 Interior 19 Vertex 20 Vertex 21 Vertex 22 Vertex 23 Vertex Table 1: RSM experiment Design and results Factors p + 5 + 5 points Extra runs for TI Increase in size 2 16 7 44% 4 25 10 40% 6 38 13 34% 8 55 15 27% 10 76 16 21% Table 2: Extra runs needed for Tolerance interval sizing to FDS > 90% (p = # model parameters) Figure 1: Specifications on graphical overlay (points shown in red) Figure 2: QbD Design Space for tableting process : GranulationB: LubrificationDissolution: : : : GranulationB: LubrificationDissolution: TI: : TI: : TI: Figure 3.