Transcription of FreqResponse Analysis Design
1 MechatronicsFrequency Response Analysis & DesignK. Craig1 Frequency Response Analysis & Design In conventional control- system Analysis there are two basic methods for predicting and adjusting a system s performance without resorting to the solution of the system s differential equation. They are: Root-Locus Method Frequency-Response Method For the comprehensive study of a system by conventional methods it is necessary to use both methods of Response Analysis & DesignK. Craig2 Root-Locus Method Precise root locations are known and actual time response is easily obtained by means of the inverse Laplace Transform. Frequency-Response Method Frequency response is the steady-state response of a system to a sinusoidal input. In frequency-response methods, we vary the frequency of the input signal over a certain range and study the resulting response. The Design of feedback control systems in industry is probably accomplished using frequency-response methods more often than any other, primarily because it provides good designs in the face of uncertainty in the plant Response Analysis & DesignK.
2 Craig3 Many times performance requirements are given in terms of frequency response and/or time response. Noise, which is always present in any system , can result in poor overall performance. Frequency response permits Analysis with respect to this. When the transfer function for a component is unknown, the frequency response can be determined experimentally and an approximate expression for the transfer function can be obtained from the graph of the experimental data. The Nyquist stability criterion enables one to investigate both the absolute and relative stabilities of linear closed-loop systems from a knowledge of their open-loop frequency-response Response Analysis & DesignK. Craig4 Frequency-response tests are, in general, simple and can be made accurately by readily-available equipment, , dynamic signal analyzer. Correlation between frequency and transient responses is indirect, except for 2nd-order systems. In designing a closed-loop system , we adjust the frequency-response characteristic of the open-loop transfer function by using several Design criteria in order to obtain acceptable transient-response characteristics for the Response Analysis & DesignK.
3 Craig5 For a stable, linear, time-invariant system , the mathematical model is the linear ODE with constant coefficients: qois the output (response) variable of the system qiis the input (excitation) variable of the system anand bmare the physical parameters of the systemnn1ooonn110onn1mm1iiimm110imm1dqdq dqaaaaqdtdtdtdqdqdq bbbbqdtdtdt ++++=++++LLMechatronicsFrequency Response Analysis & DesignK. Craig6 If the input to this system is a sine wave, the steady-state output (after the transients have died out) is also a sine wave with the same frequency, but with a different amplitude and phase angle. system Input: system Steady-State Output: Both amplitude ratio, Qo/Qi, and phase angle, , change with frequency, . The frequency response can be determined analytically from the Laplace transfer function:iiqQsin(t)= ooqQsin(t)= + G(s)s = i SinusoidalTransfer FunctionM()() MechatronicsFrequency Response Analysis & DesignK.
4 Craig7 A negative phase angle is called phase lag, and a positive phase angle is called phase lead. If the system being excited were a nonlinear or time-varying system , the output might contain frequencies other than the input frequency and the output-input ratio might be dependent on the input magnitude. Any real-world device or process will only need to function properly for a certain range of frequencies; outside this range we don t care what Response Analysis & DesignK. Craig8 SystemFrequencyResponseMechatronicsFrequ ency Response Analysis & DesignK. Craig9 When one has the frequency-response curves for any system and is given a specific sinusoidal input, it is an easy calculation to get the sinusoidal output. What is not obvious, but extremely important, is that the frequency-response curves are really a complete description of the system s dynamic behavior and allow one to compute the response for any input, not just sine waves.
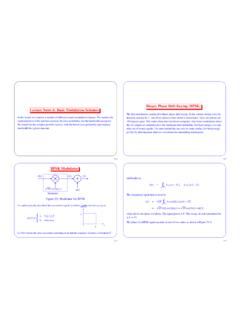
5 Every dynamic signal has a frequency spectrum and if we can compute this spectrum and properly combine it with the system s frequency response, we can calculate the system time Response Analysis & DesignK. Craig10 The details of this procedure depend on the nature of the input signal; is it periodic, transient, or random? For periodic signals (those that repeat themselves over and over in a definite cycle), Fourier Series is the mathematical tool needed to solve the response problem. Although a single sine wave is an adequate model of some real-world input signals, the generic periodic signal fits many more practical situations. A periodic function qi(t) can be represented by an infinite series of terms called a Fourier Response Analysis & DesignK. Craig11()()()0innn1T2niT2T2niT2a22n2nqta costbsintTTTT2naqtcostdtT2nbqtsintdtT = =++ = = FourierSeriesMechatronicsFrequency Response Analysis & DesignK. Craig12tqi(t)+ the Square Wave()() +=== = += = += =+ ()()4in100tsin300t3 + + LMechatronicsFrequency Response Analysis & DesignK.
6 Craig13 The term for n = 1 is called the fundamental or first harmonic and always has the same frequency as the repetition rate of the original periodic wave form (50 Hz in this example); whereas n = 2, 3, .. gives the second, third, and so forth harmonic frequencies as integer multiples of the first. The square wave has only the first, third, fifth, and so forth harmonics. The more terms used in the series, the better the fit. An infinite number gives a perfect Response Analysis & DesignK. (sec)amplitudePlot of the Fourier Series for the square wave through the third harmonic ()()() + + MechatronicsFrequency Response Analysis & DesignK. Craig15 For a signal of arbitrary periodic shape (rather than the simple and symmetrical square wave), the Fourier Series will generally include all the harmonics and both sine and cosine terms. We can combine the sine and cosine terms using: Thus()()()221 AcostBsintCsintCABAtanB + = + =+ =()()()ii0i111i212qtAAsintAsin2t=+ + + + +LMechatronicsFrequency Response Analysis & DesignK.
7 Craig16 A graphical display of the amplitudes (Aik) and the phase angles ( k) of the sine waves in the equation for qi(t) is called the frequency spectrum of qi(t). If a periodic qi(t) is applied as input to a system with sinusoidal transfer function G(i ), after the transients have died out, the output qo(t) will be in a periodic steady-state given by: This follows from superposition and the definition of the sinusoidal transfer function.()()()()()oo0o111o212okikkkkkqt AAsintAsin2tAAGiGi=+ + + + += = + LMechatronicsFrequency Response Analysis & DesignK. Craig17 Review of Frequency-Response Performance Specifications Let V be a sine wave (U = 0) and wait for transients to die out. Every signal will be a sine wave of the same frequency. We can then speak of amplitude ratios and phase angles between various pairs of (i)(i)V1 GGH(i) =+ MechatronicsFrequency Response Analysis & DesignK. Craig18 The most important pair involves V and C.
8 Ideally (C/V)(iw) = for all frequencies. Amplitude ratio and phase angle will approximate the ideal values of and 0 degrees for some range of low frequencies, but will deviate at higher Response Analysis & DesignK. Craig19 Typical Closed-Loop Frequency-Response CurvesAs noise is generally in a band of frequencies above the dominant frequency band of the true signal, feedback control systems are designed to have a definite passband in order to reproduce the true signal and attenuate Response Analysis & DesignK. Craig20 The frequency at which a resonant peak occurs, r, is a speed-of-response criterion. The higher r, the faster the system response. The peak amplitude ratio, Mp, is a relative-stability criterion. The higher the peak, the poorer the relative stability. If no specific requirements are pushing the designer in one direction or the other, Mp= is often used as a compromise between speed and stability.
9 For systems that exhibit no peak, the bandwidth is used for a speed of response specification. The bandwidth is the frequency at which the amplitude ratio has dropped to times its zero-frequency value. It can of course be specified even if there is a peak. It is the maximum frequency at which the output of a system will satisfactorily track an input Response Analysis & DesignK. Craig21 If we set V = 0 and let U be a sine wave, we can measure or calculate (C/U)(i ) which should ideally be 0 for all frequencies. A real system cannot achieve this perfection but will behave typically as shown. Closed-Loop Frequency Response to a Disturbance InputMechatronicsFrequency Response Analysis & DesignK. Craig22 Two open-loop performance criteria in common use to specify relative stability are gain marginand phase margin. The open-loop frequency response is defined as (B/E)(i ).
10 One could open the loop by removing the summing junction at R, B, E and just input a sine wave at E and measure the response at B. This is valid since (B/E)(i ) = G1G2H(i ). Open-loop experimental testing has the advantage that open-loop systems are rarely absolutely unstable, thus there is little danger of starting up an untried apparatus and having destructive oscillations occur before it can be safely shut down. The utility of open-loop frequency-response rests on the Nyquist stability Response Analysis & DesignK. Craig23 Gain margin (GM) and phase margin (PM) are in the nature of safety factors such that (B/E)(i ) stays far enough away from 1 -180 on the stable side. Gain margin is the multiplying factor by which the steady-state gain of (B/E)(i ) could be increased (nothing else in (B/E)(i ) being changed) so as to put the system on the edge of instability, , (B/E)(i )) passes exactly through the -1 point.