Example: confidence
Frequency and Phase Modulation
2 Definition of an FM Signal • For a baseband signal, x(t): – k f is the frequency deviation constant in Hz/volt – A constant envelope ...
Tags:
Information
Domain:
Source:
Link to this page:
Documents from same domain

CHAPTER Classification and Assessment of …
www.csun.eduCHAPTER Classification and Assessment of Abnormal Behavior CHAPTER OUTLINE HOW ARE ABNORMAL BEHAVIOR PATTERNS CLASSIFIED? 70–77 The DSM and Models of Abnormal Behavior STANDARDS OF ASSESSMENT 77–80 Reliability Validity Cognitive Assessment

Dissociative and Somatoform Disorders
www.csun.edu212 Chapter 7 In early versions of the DSM, dissociative and somatoform disorders were classified with the anxiety disorders under the general category of …
Chapter 3: Solutions of Homework Problems …
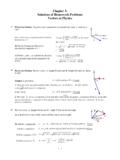
www.csun.edu3 – 1 Chapter 3: Solutions of Homework Problems Vectors in Physics 12. as drawn at Picture the Problem: The given vector components correspond to the vector r & right.
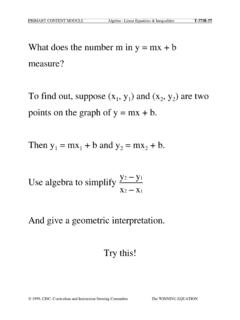
PRIMARY CONTENT MODULE Algebra - Linear …
www.csun.eduPRIMARY CONTENT MODULE Algebra - Linear Equations & Inequalities T-37/H-37 © 1999, CISC: Curriculum and Instruction Steering Committee The WINNING EQUATION
Chapter 8: Quantitative Sampling
www.csun.edu22 Chapter 8: Quantitative Sampling I. Introduction to Sampling a. The primary goal of sampling is to get a representative sample, or a small collection of units
th - csun.edu
www.csun.eduRunning head: APA FORMAT EXAMPLE 1 How to Do that Annoying APA Format Stuff: A Brief Overview of the 6th Edition Scott W. Plunkett California State University, Northridge
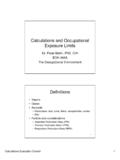
Calculations and Occupational Exposure Limits
www.csun.eduCalculations Evaluation Control 3 5 OELs • Time-weighted average (TWA) • Ceiling value (C) • Short-Term Exposure Limit (STEL) • Immediately Dangerous to Life and Health
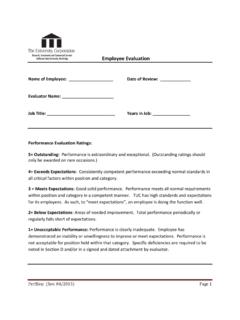
Employee Evaluation - California State University, …
www.csun.eduPerfEval (Rev. 04/2013) Page 3 Performance Categories Rating Ethics/Fraud/Integrity Practices excellent work ethics. Properly handles confidential information.
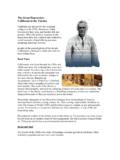
The Great Depression: California in the Thirties
www.csun.eduThe Great Depression: California in the Thirties . California was hit hard by the economic collapse of the 1930s. Businesses failed, workers lost …
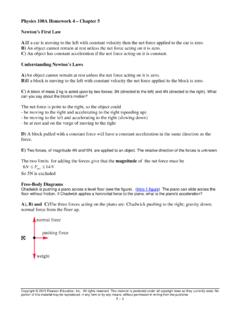
Physics 100A Homework 4 – Chapter 5 Newton’s …
www.csun.eduChapter 5: Newton’s Laws of Motion thJames S. Walker, Physics, 4 Edition C) and D) Magnitude and direction of the acceleration
Related documents

Lesson 2: Frequency Measures Used in Epidemiology
hetv.orgLesson 2 Frequency Measures Used in Epidemiology Epidemiologists use a variety of methods to summarize data. One fundamental method is the frequency distribution. The frequency distribution is a table which displays how many people fall into each category of a variable such as age, income level, or disease status.
Chapter 8 Frequency Modulation (FM) Contents
user.eng.umd.eduBT = 2(∆f +fm) Hz (16) where ∆f is the peak frequency deviation and fm is the maximum baseband message frequency component. Example Commercial FM signals use a peak frequency deviation of ∆f = 75 kHz and a maximum baseband message frequency of fm = 15 kHz. Carson’s rule estimates the FM signal bandwidth as BT = 2(75+15) = 180 kHz which ...

Chapter 2: Frequency Distributions and Graphs (or making ...
math.ucdenver.eduCh2: Frequency Distributions and Graphs Santorico -Page 41 Histogram – a graph that displays quantitative data by using contiguous vertical bars (unless the frequency of a class is 0) of various heights to represent the frequencies of the classes. Steps: 1. Draw and label the x and y axes. 2. Represent the frequency on the y axis and the class

Center Frequencies and High/Low Frequency Limits for ...
courses.physics.illinois.edu1 Center Frequencies and High/Low Frequency Limits for Octave Bands, 1/2- and 1/3-Octave Bands Octave Bands: The audio spectrum from ~ 20 Hz to ~ 20 KHz can be divided up into ~ 11 octave bands. If we set/define the 7th octave band’s center frequency to be 7 1000 f ctr Hz, then all lower center frequencies for octave bands can be defined from each other using the formula …
Making Frequency Table - My Math Classes
www.mymathclasses.comElementary Statistics Making Frequency Table Objective: 1 Find the minimum and the maximum value. 2 Find the value of the range. 3 Find the class width if we wish to have a frequency distribution table with 5 classes. Solution: Since our data is …
Chapter 2: Frequency Distributions - FTMS
ftms.edu.myFrequency Distributions •After collecting data, the first task for a researcher is to organize and simplify the data so that it is possible to get a ... simple number such as 2, 5, 10, and so on. •Each interval begins with a value that is a multiple of the interval width. The interval width

Rife Frequency List(1)
royalrife.comCAFL is the Consolidated Annotated Frequency List, amassed from the experience of Rife experimenters over years. XTRAis a collectionof sets from various sources, all chosenfor their reputationfor effectiveness.

NAME: DATE: GRAMMAR WORKSHEET ADVERBS of …
www.allthingsgrammar.comAdverbs of Frequency Level Beginning to Elementary (CEFR A1) ANSWER KEY 1. always 2. hardly ever / rarely / seldom 3. almost always 4. never 5. rarely / hardly ever 6. seldom / rarely / hardly ever 7. always 8. never 9. sometimes 10. almost always 11. usually 12. seldom / rarely / hardly ever Grades as percentages My Notes
Frequency Domain and Fourier Transforms
www.princeton.edu2 CHAPTER 4. FREQUENCY DOMAIN AND FOURIER TRANSFORMS So, x(t) being a sinusoid means that the air pressure on our ears varies pe- riodically about some ambient pressure in a manner indicated by the sinusoid. The sound we hear in this case is called a pure tone.