Transcription of Friedman's Two-way Analysis of Variance by Ranks ...
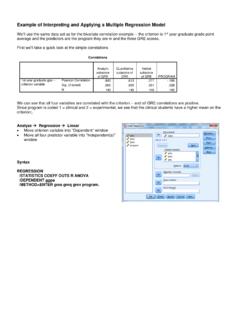
1 Friedman's Two-way Analysis of Variance by Ranks -- Analysis of k-Within-Group Data with a Quantitative Response Variable Application: This statistic has two applications that can appear very different, but are really just two variations of the same statistical question. In one application the same quantitative variable is measured at two or more different times from the same sample (or from two or more samples that have been matched on one or more important variables). In the other application, two or more comparable quantitative variables are measured from the same sample (usually at the same time).
2 In both applications, Friedman's test is used to compare the distributions of the two or more quantitative variables. Thus, it is applied in the same data situation as an ANOVA for dependent samples except that it is used when the data are either from a too-small sample, are importantly non-normally distributed, or the measurement scale of the dependent variable is ordinal (not interval or ratio). It is important to remember the null hypothesis, and to differentiate it from the null for the dependent ANOVA.
3 There are two specific versions of the H0:, depending upon whether one characterizes the k conditions as representing a single population under two or more different circumstances ( , comparing treated vs. not treated or comparing different treatments -- some consider this a representation of two or more different populations) or as representing comparable variables measured from a single population (as in the example below). Here are versions of the H0: statement for each of these characterizations.
4 H0: The populations represented by the k conditions of the have the same distribution of scores. To reject H0: is to say that the populations represented by the different conditions differ in some way, center, spread and/or shape. When the forms of the distributions from the two samples are similar (as is often the case -- check the size and symmetry of the IQR), then rejecting H0: is interpreted to mean that populations (or circumstances) tend to have some pattern of larger and smaller scores (different medians) among them.
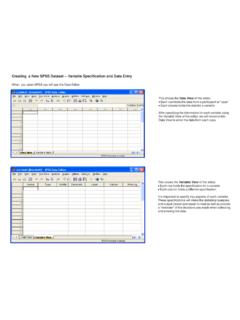
5 H0: The population has the same distribution of scores on the different measures represented by the conditions. To reje ct H0: is to say that the distributions of the variables are different in some way, center, spread and/or shape. When the forms of the distributions are similar (as is often the case -- check the size and symmetry of the IQR), then rejecting the H0: is interpreted to mean that the variables have some pattern of larger and smaller scores (medians) among them. The data: In this Analysis the one variable is the type of animal (fish, reptiles, or mammals), and the response variable is the number of animals on display.
6 From our database, we use three variables reptnum (number of reptiles on display), fishnum (number of fishon display) and mamlnum (number of mammals on display). These scores are shown for the 12 stores below (reptnum, fishnum, ). 12,32,34 14,41,38 15,31,45 12,38,32 7,21,12 4,13,11. 10,17,22 4,22,9 14,24,20 4,11,8 5,17,19 10,20,8. Research Hypothesis: The data come from the Pet shop database. The researcher hypothesized that stores would tend to display more fish than other types of animals, fewer reptiles, and an intermediate number of mammals.
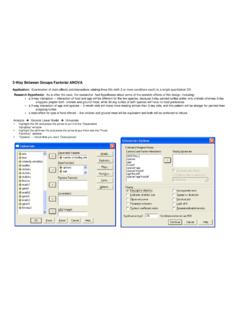
7 H0: for this Analysis : Pet stores display the same number of reptiles, fish and mammals. Step 1 Rearrange the data so that scores from each subject are in the appropriate columns, one for each condition. reptnum fishnum mamlnum 12 32 34. 14 41 38. 15 31 45. 12 38 32. 7 21 12. 4 13 11. 10 17 22. 4 22 9. 14 24 20. 4 11 8. 5 17 19. 10 20 8. Step 2 Rank order the scores SEPARATELY FOR EACH SUBJECT'S DATA with the smallest score getting a value of 1. If there are ties (within the scores for a subject) each receives the average rank they would have received.
8 Rank rank rank reptnum fishnum mamlnum reptnum fishnum mamlnum 12 32 34 1 2 3. 14 41 38 1 3 2. 15 31 45 1 2 3. 12 38 32 1 3 2. 7 21 12 1 3 2. 4 13 11 1 3 2. 10 17 22 1 2 3. 4 22 9 1 3 2. 14 24 20 1 3 2. 4 11 8 1 3 2. 5 17 19 1 2 3. 10 20 8 2 3 1. Step 3 Compute the sum of the Ranks for each condition. rank rank rank reptnum fishnum mamlnum 1 2 3. 1 3 2. 1 2 3. 1 3 2. 1 3 2. 1 3 2. 1 2 3. 1 3 2. 1 3 2. 1 3 2. 1 2 3. 2 3 1. R1 = 13 R2 = 32 R3 = 27. Step 4 Determine the number of subjects. N = 12. Step 5 Determine the number of conditions.
9 K = 3. Step 6 Compute Friedman's F, using the following formula (you should carry at least 3 decimals in these calculations). 12. F = ---------------- * R2 - [3 * N * (k + 1)]. [N * k *(k+1)]. 12. = ----------------- * [132 + 322 + 272] - [3 * 12 * (3 + 1)]. [12 * 3 * (3+1)]. 12. = ----- * [169 + 1024 + 729] - 144 = [.083*1922] - 144 = 144. For small samples (k < 6 AND N < 14): Step 7 Determine the critical value of F by looking at the table of critical values for Friedman's test F(k=3, N=12, = .05) = Step 8 Compare the obtained F and the critical F values to determine whether to retain or reject the null hypothesis.
10 -- if the obtained F value (from Step 6) is larger than the critical value of F, then reject H0: -- if the obtained F value is less than or equal to the critical value of F, then reject H0: For the example data, we would decide to reject the null hypothesis, because the obtained value of F ( ) is greater than the larger critical F value ( ). For large samples (k > 5 OR N > 13): Step 9 Determine the critical value of F by looking at the table of critical values for the Chi-Square test (df = k - 1). (As an example, here is how you would apply this version of the significance test to these data.)