Transcription of G20 Innovation Report 2016 - OECD.org
1 Report prepared for the G20 Science, Technology and Innovation Ministers MeetingBEIJING, CHINA, 4 NOVEMBER 2016G20 Innovation Report 2016 This Report of the Organisation for Economic Co operation and Development has been prepared at the request of G20 Leaders (Hangzhou Summit Communique, 4 5 September 2016 ). An initial prototype was prepared for the Third G20 Sherpa Meeting in Xiamen, China, 23 25 June 2016 . This Report is based on material fr om the OECD's Science, Technology and Industry Scoreboard 2015 (with data updates where available) and the forthcoming Science, Technology and Innovation Outlook 2016 . The latter publication benefits from policy information gathered via the joint European Commission/ OECD International Survey on Science, Technology and Innovation Policy (STIP).
2 The opinions expressed and the arguments employed herein do not necessarily reflect the official views of OECD countries. This Report and any map included herein are without prejudice to the status of or sovereignty over any territory, to the delimitation of international frontiers and boundaries and to the name of any territory, city or area. 2016G20 Innovation Report 2016 OECD, 2016 3 TABLE OF CONTENTS PART 1: SELECTED Innovation INDICATORS .. 5 Emerging players in the science landscape .. 6 Monitoring STI performance and progress .. 7 Funding long term, higher risk research .. 8 Innovation for global challenges .. 9 Enabling the Next Industrial Revolution .. 10 Addressing common challenges through international co operation in science and Innovation .
3 11 Raising the quality of science .. 12 Promoting excellence .. 13 Nurturing talent and skills .. 14 Investing in scientists and engineers .. 15 Promoting student exchanges .. 16 Facilitating researcher mobility .. 17 Promoting collaboration in Innovation among firms .. 18 Supporting business Innovation .. 19 Fostering entrepreneurship .. 20 Empowering society with science and technology .. 21 PART 2: COUNTRY PROFILES .. 23 Argentina .. 24 Australia .. 26 Brazil .. 28 Canada .. 30 China .. 32 G20 Innovation Report 2016 4 OECD, 2016 France .. 34 Germany .. 36 India .. 38 Indonesia .. 40 Italy .. 42 Japan .. 44 Korea .. 46 Mexico .. 48 Russian Federation .. 50 South Africa .. 52 Turkey .. 54 United Kingdom .. 56 United States .. 58 European Union.
4 60 Readers 62 FURTHER READING .. 63 Part 1 SELECTED Innovation INDICATORS The indicators presented here of science and Innovation in the global economy highlight G20 economies performance in a selection of areas, and track discussions and comments made by the G20 Innovation Task Force. They are mainly based on indicators contained in the OECD Science, Technology and Industry Scoreboard 2015. The next OECD STI Scoreboard publication will be released in 2017. Indicators are presented for the following topics: Emerging players in the science landscape Monitoring STI performance and progress Funding long term, higher risk research Innovation for global challenges Enabling the Next Industrial Revolution Addressing common challenges through international co operation in science and Innovation Raising the quality of science Promoting excellence Nurturing talent and skills Investing in scientists and engineers Promoting student exchanges Facilitating researcher mobility Promoting collaboration in Innovation among firms Supporting business Innovation Fostering entrepreneurship Empowering society with science and technology G20 Innovation Report 2016 6 OECD.
5 2016 Emerging players in the science landscape Faced with major economic, societal and environmental challenges at a time when budgets are under pressure, policy makers look for evidence to help them guide efforts to ensure that investments in science and research help improve people s lives. The United States is the world s largest R&D performer, with nearly USD 433 bi llion of domestic R&D expenditures in 2013. This exceeds by about one quarter the amount of R&D performed in the People s Republic of China (hereafter China ), the second largest performer, which is broadly on par with the combined EU28 area. Among the G20, Korea has the highest ratio of R&D expenditures to gross domestic product (GDP) owing to rapid increases in recent years. Emerging G20 economies account for a growing share of the world s R&D.
6 Increasing national investment in R&D requires the combination of public and private efforts. In the more developed economies, the business sector accounts for the largest share of R&D spending. Here, it is mostly directed towards developing new products and processes to introduce in the market, building on existing and developing new knowledge. Governments and higher education institutions play a key role in developing both fundamental and applied knowledge that provides the basis required for major, paradigm changing breakthroughs. However, excessive reliance on public sector investment can prevent economies from reaping the economic benefits of knowledge investments. Overall, the cross country relationship between R&D intensity and business financing of R&D expenditure suggests that high levels of economy wide R&D investment are not attainable without a strong private sector commitment.
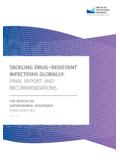
7 Figure 1. R&D in selected G20 economies, 2013 Sources: OECD, Main Science and Technology Indicators database, January 2016 , ; data for Brazil from UNESCO Institute for Statistics, November 2015. WHAT DO WE MEAN BY R&D? As defined in the OECD s Frascati Manual ( ), R&D comprises basic research (aimed at creating new knowledge with no specific application in view), applied research (new knowledge towards a specific practical aim) and experimental development (to develop new products or processes). OECD data show that businesses are far more likely to invest in development than in research. The Frascati Manual recommends reporting separately the performance and funding of R&D, grouped by "broad" sectors that include business, higher education, government and other non profits.
8 Business or industry funding of R&D comprises the portion of R&D carried out within any sector of the economy that is directly funded by resident businesses. Typically, the share of R&D financed by industry is less than the share of R&D performed by firms in this sector, but this excludes the financing of R&D performed abroad, including by affiliates. 102030405060708090100 Gross domestic expenditures on R&D as a percentage of GDPP ercentage of GERD financed by industryOECD average = average = countriesNon-G20 OECD countries R&D expenditures in 2010 USD - constant prices and PPP1 billion10 billion100 billionG20 Innovation Report 2016 OECD, 2016 7 Monitoring STI performance and progress Many OECD countries and G20 economies have adopted quantitative targets to benchmark their science, technology and Innovation (STI) performance and progress, especially through targets for R&D spending.
9 The target volume of R&D expenditure is often expressed as a percentage of GDP. With STI budgets under pressure, many governments capacity to drive further increases in domestic R&D expenditure is limited. The gap between overall strategic R&D spending targets and current R&D expenditure in most cases remains too large to be closed by the foreseen date. The relevance and feasibility of targets also largely depends on the structure of economies and their positioning in gl obal value chains, as industries differ in their propensity to carry out R&D. In the G20, the industrial structure varies considerably from service based economies to manufacturing or resource based ones. The Innovation potential of economies with different sectoral profiles may be more responsive to forms of knowledge based capital, Innovation assets beyond R&D, thus limiting the potential relevance of the R&D intensity target.
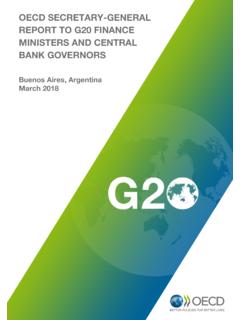
10 Figure 2. National R&D expenditure targets and gap with current levels of GERD intensity, G20 economies, 2014 As a percentage of GDP Note: indef. is an abbreviation for indefinite or no fixed end date for reaching the target. Sources: OECD, Main Science and Technology Indicators database, , January 2016 ; data for Brazil, India, Indonesia and Saudi Arabia from UNESCO Institute for Statistics, November 2015; data on national R&D targets from country responses to OECD STI Outlook policy questionnaire 2014 and national sources (Brazil). R&D TARGETS Information on R&D targets is derived from information collected through the questionnaire for the OECD Science, Technology and Innovation Outlook. Gross domestic expenditure on R&D (GERD) is the main aggregate used for international comparisons of R&D expenditures.