Transcription of Gamma Ray Spectroscopy - Department of Physics
1 GammaRaySpectroscopyExperiment GRSU niversity of Florida Department of PhysicsPHY4803L Advanced Physics LaboratoryObjectiveYou will learn about and use a scintillationspectrometer to study Gamma rays and theirinteractions with matter. You will: Take a pulse height spectrum for amonochromatic source and identify thephotopeak, Compton edge, and backscat-ter peak associated with the photoelectriceffect and Compton scattering. Measure the dead time of the spectrom-eter and learn how to use the live timecorrection.
2 Perform background subtractions. Measure the spectrometer resolution andstudy its energy dependence. Perform an energy calibration using a va-riety of known sources and then use thecalibration to determine the energy ofgamma rays emitted by an unknown isotope. Determine the absolute activity of a22 Nasample based on a sum peak analysis. Make and analyze halflife measurementsof an excited nuclear Jerome L. DugganLaboratory Investiga-tions in Nuclear Science, 1988, The EG&G ORTECE xperiments in NuclearScience, 1984, EG&G Melissinos,Experiments in ModernPhysics, 1966, Academic , Aten, Jr.
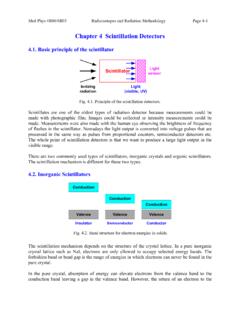
3 AndJ. Th. VeenboerAbsolute Standardizationwith a NaI (Tl) Crystal I,Int. J. ofApp. Radiation and Isotopes, 1963,14pp. DetectorA block diagram for a typical scintillation de-tection system is shown in The scin-tillation detector is illustrated in Ourdetector has a 4 4 inch cylindrical NaI scintil-lation crystal which is activated with about 1part in 103thallium impurities. Through var-ious processes, a Gamma ray passing into thecrystal may interact with it creating many vis-ible and ultraviolet photons (scintillations).
4 To detect the scintillation photons, the crys-tal is mounted against a photomultiplier tube(PMT) and the scintillator/PMT (detector) isenclosed in a reflective, light-tight housing. ToGRS 1 GRS 2 Advanced Physics LaboratoryOscillo-scopeLinearAmplifierPM BaseNaI (Tl)DetectorSourceHV PowerSupplyPreampMulti-ChannelAnalyzerFi gure 1:Block diagram for a scintillation de- tector the effects of background Gamma ra-diation, the detector is surrounded by a thickmetal shielding PMT consists of a photocathode fol-lowed by a series of dynodes (6-10 is typical)followed by, and ending with a collection an-ode.
5 scintillation photons striking the photo-cathode eject electrons via the photoelectriceffect. A high voltage (HV) power supply anda resistor chain (not shown) bias the cathode,dynodes, and anode so as to accelerate elec-trons from the cathode into the first dynode,from one dynode to the next, and from thefinal dynode to the anode collector. Each in-cident electron strikes a dynode with enoughenergy to eject around 5-10 (secondary) elec-trons from that dynode. For each initial pho-toelectron, by the end of the chain, there areon the order of 106electrons reaching the anode is connected to a charge-sensitive preamplifier which converts the col-lected charge to a proportional voltage preamp pulse is then shaped and ampli-fied by a linear amplifier before processing the amount of light (number ofphotons)
6 Produced in the scintillation crys-tal is proportional to the amount of gammaray energy initially absorbed in the crystal,so also are the number of photoelectrons fromthe cathode, the final anode charge, and theamplitude of the preamp and amplifier volt-age pulses. The overall effect is that the finalpulse height is proportional to the Gamma rayenergy absorbed in Height AnalyzerAs the name suggests, a pulse height ana-lyzer (PHA) measures the height of each in-put pulse. Special circuitry, including a sam-ple and hold amplifier and an analog to digitalconverter, determines the maximum positiveheight of the pulse a peak voltage as mightbe read off an oscilloscope trace.
7 From thepulse height, a corresponding channel numberis calculated. For example, for a PHA hav-ing 1000 channel capability and a pulse heightmeasurement range from 0 to 10 V, a pulseof height V would correspond to channel100, one of V would correspond to chan-nel 200, one of V would correspond tochannel 834, etc. After the correct channel fora given input pulse has been determined, thePHA then increments the count in that PHA can analyze pulse heights in therange 0-10 V and will be set up to sort theminto 1024 many pulses of various sizes have beenprocessed, a plot of the counts in each channelversus the channel number can be displayed toshow the distribution of pulse heights.
8 Withsome caveats to be described shortly, the pulseheight distribution from a scintillation detec-tor can be interpreted as a plot of the numberof gammas versus the energy of the gammasfrom the source, , a Gamma ray spectrumof the (radioactive) source. Spectra from pureisotopes can be found in references and com-December 1, 2021 Gamma Ray SpectroscopyGRS 33E 6 KLHOGLQJ3 KRWRFDWKRGH&RPSWRQ6 FDWWHULQJ 3 KRWRQ89 3 KRWRQV'\QRGH 3 URGXFHG IURP ORFDOH[FLWHG VWDWHV IROORZLQJLRQL]DWLRQ 6 HFRQGDU\ (OHFWURQ (PLVVLRQ 6 RXUFH (PLWWHG IURP FDWKRGH 3 KRWRHOHFWURQ$QRGH3 KRWRPXOWLSOLHU3E.)))
9 UD\3 KRWRQ3E 6 KLHOGLQJn 6 FDWWHULQJ&RPSWRQ5 HIOHFWRUn-n+1D,n-$QQLKLODWLRQ5 DGLDWLRQ+Figure 2:Schematic of a NaI detector and source showing various Gamma ray Reference with a source spectra to determine thenuclear composition of the InteractionsTo understand the pulse height distributionassociated with the Gamma rays from a ra-dioactive source, it is important to realize thatonly a fraction of the Gamma rays interactwith the scintillator; many do not interactat all and simply pass right through. More-over, there can be one or more interactionsof a Gamma and there may be multiple gam-mas emitted from a single nuclear decay.
10 Usu-ally, all energy depositions in the scintillatorfrom a single decay are effectively simultane-ous; all interactions occur over a time scalethat is small compared to the response timeof the scintillator and size of the pulse from the detector de-pends on how much Gamma ray energy is de-posited in the scintillator. For a given amountof energy, the final pulse will have a well-defined average height, but because of sta-tistical variations in light production, pho-ton collection, photoelectron production, andelectron multiplication, the pulse heights willhave a distribution of values with some pulseheights larger and some smaller than the aver-age.