Transcription of Gaussian Plumes from “Point” Sources
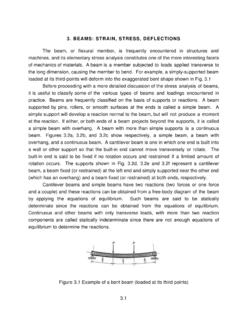
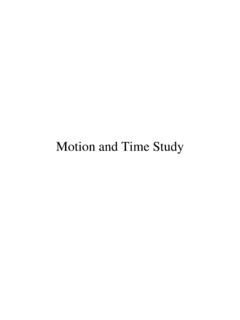
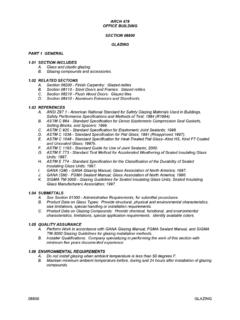
1 1 GaussianPlumes from Point Sources Time averaged vs instantaneous Plumes Simplified steady-state plume model Eddy diffusion, advection/diffusion equation Gaussian point source plume model plume sigma values vs stability and distance plume reflection Non- Gaussian Plumes plume Rise; plume trajectories Buoyancy-induced dispersion Stack downwashView from below of Coning plume under neutral atmospheric conditionsSource: Slade et al Meteorology and Atomic Energy, 1968 instantaneoustime-averaged2 InstantaneousPlume ShapeTime-averaged plume ShapeFig 4-3, in Martin et alwindDescribing plume Concentrations3 Tim s Simple plume Modelhx123mass/timepassingpoint 1=mass/timepassing thrudisk area 2mass/timepassing thrudisk area 3C1 > C2> C3=Simplified Steady-State plume Model*Pollutant is well mixed and confined within the cone*Pollutant is continuously swept thru the cone by the windConcentration vs.
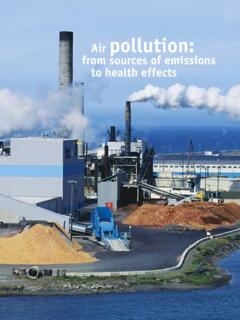
2 Distance downwind depends upon cone shape4()()2disk of areaspeed windrateemission Mass 2at air ofion Concentrat=12 Simple Model #1:()()23mm/sec g/secm g=Disk shape depends upon stability categoryMore unstable and thus more pronounced vertical spreading5 PerspectiveView of Fanning plume in Very Stable AirSource: Slade et al Meteorology and Atomic Energy, 1968 Less verticalmotion6unstableneutralstableAATi me-averaged concentration across AAGaussian (normal) distribution occurs across AA due to changes in wind direction over averaging timeShape is described by plume sigmas Most probable wind directionsourcewindMass is not uniformly distributed within the cone s volume More Detailed plume Model7()()[]functionon distributiGaussian 2disk of areaspeed windrateemission Mass 2at Conc=12 Simple Model #2.
3 XzyXis the time-averaged wind direction,Yis the cross-wind direction,Zis the vertical dimension()()[] =23mm/sec g/secm gGaussian plume Model12In order to derive an equation describing the distribution of mass within the plume , we must first consider the transport of mass within a small control volume8xzy*Transport of mass in x direction depends on the average horizontal wind*Transport of mass in the y and z directions depends on turbulent motionsdxdydz Eddy DiffusionPollutant molecules are moving around in random directions due to random eddy motionsConsider two enclosed air volumes separated by a wall(arrows represent eddy motions.)
4 Balls represent pollutant molecules)Random eddy motions in pollution -free airNow remove the wall between the enclosuresSize of eddies > size of pollutant molecules9 The rate of pollutant molecules crossing plane AA depends upon the concentration difference between the two sides. Specifically, this rate =K c/ x ,where K is termed an eddy diffusivity with units of m2/sec. The magnitude of K depends upon the magnitude of the eddy in this case, the rate of net rate of pollution crossing AA is zero (an equal number of molecules cross in both directions).
5 However the value of K remains constant throughout the experiment dxdydzChanges in x Direction:Net rate of change of mass flow = (Mass flow rate in) -(Mass flow rate out) Mass Flow Rate In = C u Ayz{ [ g/m3] [m/s] [m2]}()dxxyzyzAu C Au C Out Rate Flow Mass +=()()V u C-Au C- Change of RateNet yzxdxx = =V =Volume = dxdydzAxy= dxdyAyz= dydzAxz= dxdz10dxdydzChanges in z Direction via Turbulent Diffusion :V =Volume = dxdydzAxy= dxdyAyz= dydzAxz= dxdz{}]sec ][mm g][][m[m C K zA- In Rate Flow Mass1-23-1-2zxy =() V C K zz Change of RateNet z =A similar result is obtained in the y direction.
6 Given that thenet rate of change in the volume [ = V( c/ t)] is the change in all three directions , we obtain an overall expression in terms of x, y and z. + + = zCzyCyxCuCzyKKt Advection-Diffusion Equation+ other losses due to deposition and chemical reactions= 0 for steady-state models Advection , , transport by the mean wind, uEffect of turbulent diffusion , , exchange of polluted air parcel with surrounding air parcels. If the surrounding air is cleaner, C/ z & C/ y are negative.
7 K is the eddy diffusivity and represents the intensity of turbulent motions and varies with stability11 The Gaussian plume equationis a particular solution to this more general equation under the following assumptions:0C= t* Constant wind speed with height (u does not depend on z)* Steady state conditions* Constant eddy diffusivity (K does not depend on y or z)* Mass is conserved{}g/sec 0][for x QC >= dydzDefine:u xK 2 z2z=u xK 2 y2y= Gaussian Point Source plume Model:Wind speed evaluated at effective release heightMass emission rate}Corresponds to disk area in simple model (values depend upon downwind distance, x)Distribution of mass in vertical dimension (z) at a given downwind distance, x (includes the effect of surface reflection)Distribution of mass in cross-wind dimension (y) at a given downwind distance, xPollutant concentration as a function of downwind position (x,y,z)()()() + + =2y22222zy2 yexp2exp2expu 2Q z)
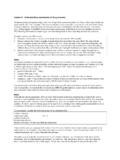
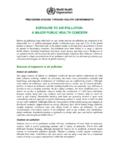
8 Y,C(x,zzhzhz Effective stack height, including rise of the hot plume near the source12 Gaussian plume (Concentrations vary with x, y and z)For a given x, the max conc. is at the plume centerline and decreases exponentially away from the centerline at a rate dependent upon the sigma values, yand z. yand zare functions of xPlumeCenterlineCross-wind distance from plume centerline (m)Vertical distance from plume centerline (m)Concentration distribution in a Gaussianplume ( y= 20 m; z= 10m; centerline concentration = )Source: Hanna et al, 1981 Note: theoretical plume has infinite extent in all directions!)
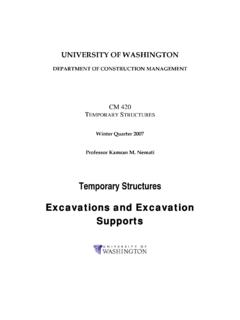
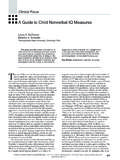
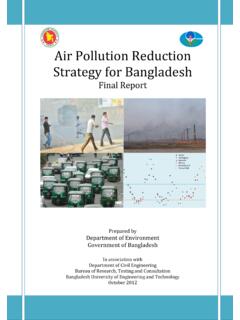
9 Y z13 Sigma-yxSigma-z14() = ()() = xis in kilometers yis in meters is inradiansCross-wind distribution:bzax= Vertical distribution:xis in kilometers zis in metersa, b depend onxPlume sigma formulas from EPA s ISC ModelPasquill Stability Category x (km) a b A* <.10 - - - - - - - > ** ** * If the calculated value of z exceed 5000 m, z is set to 5000 m. bzax= 15B* <.20 - > * All <.30 - - - - > * If the calculated value of z exceed 5000 m, z is set to 5000 m.
10 ** z is equal to 5000 m. Pasquill Stability Category x (km) a b bzax= Pasquill Stability Category x (km) a b E <.10 - - - - - - - > <.20 - - - - - - - - > bzax= Stability Category()() = plume Reflection off of the Ground(pollutant cannot penetrate the ground)Actual Source Virtual Source(below the surface)Most of plume above the surfacePlume begins to reflect off the surfaceReflected material (shaded area)