Transcription of GBD PROFILE: LEBANON
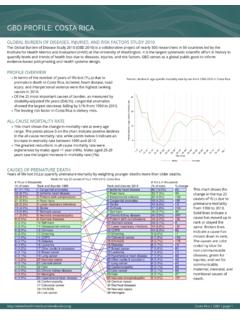
1 GLOBAL BURDEN OF DISEASES, INJURIES, and risk factors STUDY 2010 The Global Burden of Disease Study 2010 (GBD 2010) is a collaborative project of nearly 500 researchers in 50 countries led by theInstitute for Health Metrics and Evaluation (IHME) at the University of Washington. It is the largest systematic scientific effort in history toquantify levels and trends of health loss due to diseases, injuries, and risk factors . GBD serves as a global public good to informevidence-based policymaking and health systems OVERVIEWlIn terms of the number of years of life lost (YLLs) due topremature death in LEBANON , ischemic heart disease,cerebrovascular disease, and road injury were the highestranking causes in the 25 most important causes of burden, as measured bydisability-adjusted life years (DALYs), congenital anomaliesshowed the largest decrease, falling by 63% from 1990 to leading risk factor in LEBANON is dietary MORTALITY RATElThis chart shows the decline in mortality rate at every age higher points on the chart indicate that declines in mortalityrates were faster in those age groups between 1990 and greatest reductions in all-cause mortality rate wereexperienced by males aged <1 year (69%).
2 Females aged 80+years saw the smallest decrease in mortality rate (16%).Percent decline in age-specific mortality rate by sex from 1990-2010 in LebanonCAUSES OF PREMATURE DEATHY ears of life lost (YLLs) quantify premature mortality by weighting younger deaths more than older chart shows thechange in the top 25causes of YLLs due topremature mortalityfrom 1990 to lines indicate acause has moved up inrank or stayed thesame. Broken linesindicate a cause hasmoved down in causes are colorcoded by blue fornon-communicablediseases, green forinjuries, and red forcommunicable,maternal, neonatal, andnutritional causes PROFILE: | GBD | page 101530456075 Percent decline in age specific mortality rate 1 45 910 1415 1920 2425 2930 3435 3940 4445 4950 5455 5960 6465 6970 7475 7980+Age groupMalesFemales# YLLs in thousands(% of total)Rank and disorder 1990 Rank and disorder 2010# YLLs in thousands(% of total)% change4 ( )23 Asthma28 Asthma6 ( )19 Bladder cancer6 ( )18 Breast cancer8 ( )14 COPD4 ( )24 Cirrhosis4 ( )25 Colorectal cancer46 ( )3 Congenital anomalies7 ( )15 Diabetes13 ( )9 Diarrheal diseases40 Diarrheal diseases5 ( )21 Drowning31 Drowning19 ( )12 Falls7 ( )16 Hypertensive heart disease11 ( )8 Interpersonal violence82 ( )1 Ischemic heart disease36 ( )5 Lower respiratory infections9 ( )11 Lung cancer5 ( )22 Meningitis38 Meningitis11 ( )10 Neonatal encephalopathy7 ( )17 Neonatal sepsis8 ( )13 Other cardio & circulatory42 ( )4 Preterm birth complications5 ( )
3 20 Rheumatic heart disease30 Rheumatic heart disease25 ( )7 Road injury35 ( )6 Stroke70 ( )2 War & legal intervention9 ( )12 Bladder cancer554 ( )25 Brain cancer1631 Brain cancer16 ( )4 Breast cancer1427 ( )17 COPD-77 ( )18 Chronic kidney disease25239 Chronic kidney disease6 ( )19 Cirrhosis388 ( )16 Colorectal cancer11016 ( )6 Congenital anomalies-6712 ( )9 Diabetes8019 ( )10 Falls-68 ( )15 HIV/AIDS73954 HIV/AIDS9 ( )14 Hypertensive heart disease2812 ( )11 Interpersonal violence13101 ( )1 Ischemic heart disease235 ( )21 Leukemia5028 Leukemia13 ( )8 Lower respiratory infections-6415 ( )7 Lung cancer714 ( )22 Neonatal encephalopathy-624 ( )23 Neonatal sepsis-385 ( )20 Non-Hodgkin lymphoma17538 Non-Hodgkin lymphoma9 ( )13 Other cardio & circulatory916 ( )5 Preterm birth complications-6222 ( )3 Road injury-134 ( )24 Self-harm5834 Self-harm35 ( )2 Stroke-1 Ranks for top 25 causes of YLLs 1990-2010, LebanonCCCommuni cabl e, maternal , neonatal , and nutri ti onalCCNon-communi cabl eCCInj uri es010,00020,00030,00040.
4 000 YLDs0 6 days7 27 days28 364 days1 4 years5 9 years10 14 years15 19 years20 24 years25 29 years30 34 years35 39 years40 44 years45 49 years50 54 years55 59 years60 64 years65 69 years70 74 years75 79 years80+ yearsWar & disasterIntentional injuriesUnintentional injuriesTransport injuriesOther non communicableMusculoskeletal disordersDiabetes/urogen/blood/endoMenta l & behavioral disordersNeurological disordersDigestive diseasesCirrhosisChronic respiratory diseasesCardio & circulatory diseasesCancerOther communicableNutritional deficienciesNeonatal disordersMaternal disordersNTD & malariaDiarrhea/LRI/other infectiousHIV/AIDS & tuberculosisISCHEMIC HEART DISEASELOW BACK PAINMAJOR DEPRESSIVE DISORDERSTROKEDIABETESROAD INJURYFALLSIRON-DEFICIENCY ANEMIACOPDANXIETY DISORDERSNECK PAINPRETERM BIRTH COMPLICATIONSCONGENITAL ANOMALIESOTHER MUSCULOSKELETALBREAST CANCERASTHMALUNG CANCERLOWER RESPIRATORY INFECTIONSINTERPERSONAL VIOLENCEDRUG USE DISORDERSMIGRAINEOTHER CARDIO & CIRCULATORYBLADDER CANCERHYPERTENSIVE HEART DISEASECHRONIC KIDNEY DISEASE1 2 3 4 5 6 7 8 9 10 1112 1314 15 16 171819 20 21 22 23 24 25-200-150-100-50050100150200 | GBD | page 2 Percent change 1990-2010 YEARS LIVED WITH DISABILITY (YLDs)Years lived with disability (YLDs) are estimated by weighting the prevalence of different conditions based on severity.
5 The top five leadingcauses of YLDs in LEBANON are low back pain, major depressive disorder, iron-deficiency anemia, diabetes mellitus, and anxiety size of the coloredportion in each barrepresents the number ofYLDs attributable to eachcause. The height of each barshows which age groups hadthe most YLDs in 2010. Thecauses are aggregated. Forexample, musculoskeletaldisorders include low backpain and neck YLDs by cause and age 2010 DISABILITY-ADJUSTED LIFE YEARS (DALYs)Disability-adjusted life years (DALYs) quantify both premature mortality (YLLs) and disability (YLDs) within a population. In LEBANON , thetop three causes of DALYs in 2010 were ischemic heart disease, low back pain, and major depressive disorder. The causes that were inthe 10 leading causes of DALYs in 2010 and not 1990 were diabetes mellitus, iron-deficiency anemia, chronic obstructive pulmonarydisease, and anxiety top 25 causes of DALY sare ranked from left to rightin order of the number ofDALYs they contributed in2010.
6 Bars going up show thepercent by which DALYs haveincreased since 1990. Barsgoing down show the percentby which DALYs havedecreased. Globally,non-communicable diseasesand injuries are generally onthe rise, while communicable,maternal, neonatal, andnutritional causes of DALY sare generally on the causes of DALYs and percent change 1990 to 2010 for | GBD | page 3 101234567891011121314% DALYs attributable to risk factorsLeadLow bone mineral densityIntimate partner violenceAlcohol useDrug useOccupational risksIron deficiencyHigh total cholesterolAmbient PM pollutionPhysical inactivityHigh fasting plasma glucoseHigh blood pressureSmokingHigh body mass indexDietary risksWar & disasterIntentional injuriesUnintentional injuriesTransport injuriesOther non communicableMusculoskeletal disordersDiabetes/urogen/blood/endoMenta l & behavioral disordersNeurological disordersDigestive diseasesCirrhosisChronic respiratory diseasesCardio & circulatory diseasesCancerOther communicableNutritional deficienciesNeonatal disordersMaternal disordersNTD & malariaDiarrhea/LRI/other infectiousHIV/AIDS & tuberculosisAge-standardized death rates.
7 YLL rates, YLD rates, and life expectancy at birth and health-adjusted life expectancy at birth for 1990 and 2010, both sexes combinedCountryAge-standardized death rate(per 100,000)Age-standardized YLL rate(per 100,000)Age-standardized YLD rate(per 100,000)Life expectancy at birthHealth-adjusted lifeexpectancy at birth19902010199020101990201019902010199 02010 Rate Rank Rate Rank Rate Rank Rate Rank Rate Rank Rate Rank LE Rank LE Rank HALE Rank HALE RankRussia9531395214 25,715 11 25,387 13 11,536 7 11,444 14 22,775 9 15,658 5 10,092 19, 18,210 1 11,136 1 11,185 5 10,407 ,312 15 1,432 15 46,033 15 49,393 15 14,356 15 14,462 146015 15 19,850 5 16,000 6 11,926 11 11,186 19,400 3 14,343 4 11,154 4 10,843 31,563 14 26,692 14 13,528 14 14,557 15 21,908 7 11,877 2 11,630 10 11,150 8 8 2 8 4 Turkey942116286 30,025 13 16,760 8 12,442 12 11.
8 885 12 10 Uruguay73135853 18,332 2 13,126 3 11,007 3 10,540 22,551 8 22,829 12 11,589 9 11,578 11 12 Bulgaria864874711 20,104 6 16,486 7 10,860 2 11,095 ,014 1476612 24,451 10 17,273 10 11,333 6 10,953 Lucia891107229 25,875 12 17,785 11 13,328 13 14,233 13 11 12 19,688 4 17,271 9 11,583 8 10,994 FACTORSO verall, the three risk factors that account for the most disease burden in LEBANON are dietary risks , high body-mass index, and tobaccosmoking. The leading risk factors for children under 5 and adults aged 15-49 years were suboptimal breastfeeding and dietary risks ,respectively, in graph shows the top 15risk factors for LEBANON . Thecolored portion of each barrepresents the specificdiseases attributable to thatrisk factor while bar sizerepresents the percentage ofDALYs linked to specific of disease attributable to 15 leading risk factors in 2010, expressed as a percentage of LEBANON DALYsCOUNTRY BENCHMARKING OF BURDEN OF DISEASEU nderstanding the relative performance of LEBANON against other comparator countries provides key insight into public health successesand areas where LEBANON might be falling behind.
9 The table identifies LEBANON 's rank across 14 other comparator countries, selectedand ordered by income per capita, for five metrics of interest, with 1 indicating the best rank and 15 indicating the worst rates are used to make meaningful comparisons across time by adjusting for changes in population size and expectancy incorporates mortality, and health-adjusted life expectancy further incorporates years lived in less than ideal 2010, LEBANON ranked 2nd for age-standardized YLL rate and 8th for age-standardized YLD | GBD | page 4 Ranking of leading age-standardized rates of disability-adjusted life years (DALYs) relative to comparator countries in 1990 CountryRussia12 1 11 5 12 4 14 14 13 9 6 5 9 1 3 11 4 13 9 2 8 13 2 11 10 Mexico2 1 9 8 1 12 2 10 1 2 7 13 4 13 2 12 2 15 7 4 11 3 4 3 7 Chile3 1 8 4 3 11 3 3 6 11 2 4 2 3 6 2 11 10 15 5 14 7 5 8 12 Gabon6 1 15 14 9 15 15 15 10 13 13 15 15 10 11 14 15 11 12 7 10 1 9 4 15 Malaysia9 1 3 2 8 8 11 7 2 12 11 3 13 8 7 3 9 1 2 15 2 9 6 5 6 Argentina7 1 10 12 7 3 5 2 7 7 8 7 5 4 5 5 13 8 14 10 15 10 7 14 13 Botswana1 1 1 9 6 13 6 4 8 1 14 14 14 11 13 13 6 12 11 12 7 4 15 1 3 Lebanon10 15 13 10 4 5 8 9 11 15 10 9 8 9 10 4 7 6
10 3 6 4 8 8 13 5 Turkey13 1 12 13 15 14 13 8 12 8 12 12 11 6 12 6 14 5 1 13 3 15 13 6 11 Uruguay5 1 6 6 5 2 4 5 5 6 4 6 3 5 8 7 12 4 13 8 13 14 3 15 9 Belarus14 1 14 3 10 1 10 12 14 10 5 2 10 2 4 10 3 7 8 1 9 12 1 10 8 Bulgaria11 1 7 1 14 9 1 6 15 14 3 1 7 7 1 1 5 3 10 11 5 11 10 9 2 Mauritius15 1 2 11 13 7 7 1 3 3 1 8 12 15 15 8 1 2 4 9 1 5 14 2 1 Saint Lucia4 1 5 15 11 10 9 11 4 4 15 10 6 14 14 15 8 9 5 14 6 2 12 12 14 Venezuela8 1 4 7 2 6 12 13 9 5 9 11 1 12 9 9 10 14 6 3 12 6 11 7 4 Ranking of leading age-standardized rates of disability-adjusted life years (DALYs) relative to comparator countries in 2010 CountryRussia14 13 11 15 3 13 11 10 8 5 8 6 12 9 12 3 12 12 12 15 11 2 10 3 2 Mexico5 1 1 1 13 11 2 3 3 1 7 8 13 11 2 1 2 9 13 6 7 4 1 6 15 Chile2 7 2 2 1 4 8 2 2 11 14 4 6 13 3 6 6 3 7 10 1 5 6 1 9 Gabon7 10 14 12 12 15 12 11 15 14 11 15 14 12 6 13 4 15 10 13 5 12 8 12 12 Malaysia11 2 10 9 8 8 10 4 14 6 2 1 1 5 5 8 9 14 4 3 10 9 3 5 11 Argentina6 6 8 5 4 6 6 6 6 13 15 12 11 15 13 5 10 13 9 12 2 10 9 8 10 Botswana1 8 15 6 9 9 1 14 13 12 12 10 2 6 1 12 1 8 14 7 6 13 2 14 6 Lebanon10 11 9 4 10 5 15 12 5 7 3 7 9 3 15 9 8 1