Transcription of GBD PROFILE: SERBIA
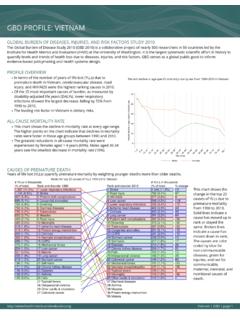
1 GLOBAL BURDEN OF DISEASES, INJURIES, AND RISK FACTORS STUDY 2010 The Global Burden of Disease Study 2010 (GBD 2010) is a collaborative project of nearly 500 researchers in 50 countries led by theInstitute for Health Metrics and Evaluation (IHME) at the University of Washington. It is the largest systematic scientific effort in history toquantify levels and trends of health loss due to diseases, injuries, and risk factors. GBD serves as a global public good to informevidence-based policymaking and health systems OVERVIEWlIn terms of the number of years of life lost (YLLs) due topremature death in SERBIA , ischemic heart disease,cerebrovascular disease, and trachea, bronchus, and lungcancers were the highest ranking causes in the 25 most important causes of burden, as measured bydisability-adjusted life years (DALYs)
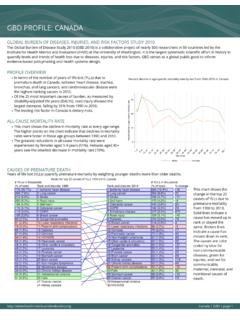
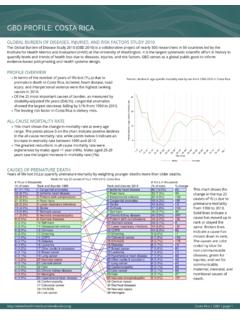
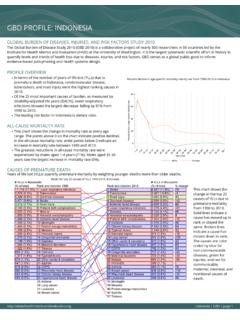
2 , major depressive disordershowed the largest decrease, falling by 28% from 1990 to leading risk factor in SERBIA is dietary MORTALITY RATElThis chart shows the decline in mortality rate at every age higher points on the chart indicate that declines in mortalityrates were faster in those age groups between 1990 and greatest reductions in all-cause mortality rate wereexperienced by males aged <1 year (75%). Males aged 80+ yearssaw the smallest decrease in mortality rate (7%).Percent decline in age-specific mortality rate by sex from 1990-2010 in SerbiaCAUSES OF PREMATURE DEATHY ears of life lost (YLLs) quantify premature mortality by weighting younger deaths more than older chart shows thechange in the top 25causes of YLLs due topremature mortalityfrom 1990 to lines indicate acause has moved up inrank or stayed thesame.
3 Broken linesindicate a cause hasmoved down in causes are colorcoded by blue fornon-communicablediseases, green forinjuries, and red forcommunicable,maternal, neonatal, andnutritional causes PROFILE: | GBD | page 101530456075 Percent decline in age specific mortality rate 1 45 910 1415 1920 2425 2930 3435 3940 4445 4950 5455 5960 6465 6970 7475 7980+Age groupMalesFemales# YLLs in thousands(% of total)Rank and disorder 1990 Rank and disorder 2010# YLLs in thousands(% of total)% change18 ( )18 Brain cancer31 ( )14 Breast cancer35 ( )12 COPD16 ( )21 Cardiomyopathy16 ( )23 Cervical cancer16 ( )20 Chronic kidney disease24 ( )15 Cirrhosis37 ( )10 Colorectal cancer52 ( )7 Congenital anomalies36 ( )11 Diabetes24 ( )16 Hypertensive heart disease18 ( )19 Interpersonal violence26 Interpersonal violence297 ( )2 Ischemic heart disease15 ( )25 Leukemia16 ( )24 Liver cancer43 ( )8 Lower respiratory infections103 ( )
4 3 Lung cancer25 ( )17 Neonatal encephalopathy44 Neonatal encephalopathy37 ( )9 Other cardio & circulatory16 ( )22 Pancreatic cancer66 ( )5 Preterm birth complications59 ( )6 Road injury65 ( )4 Self-harm34 ( )13 Stomach cancer300 ( )1 Stroke21 ( )15 Brain cancer1835 ( )11 Breast cancer1140 ( )8 COPD1421 ( )16 Cardiomyopathy2715 ( )22 Cervical cancer-919 ( )17 Chronic kidney disease1724 ( )12 Cirrhosis051 ( )5 Colorectal cancer3713 ( )25 Congenital anomalies-7545 ( )6 Diabetes2317 ( )20 HIV/AIDS2748 HIV/AIDS36 ( )9 Hypertensive heart disease52333 ( )1 Ischemic heart disease1215 ( )21 Leukemia-216 ( )19 Liver cancer416 ( )18 Lower respiratory infections-61105 ( )3 Lung cancer236 ( )10 Other cardio & circulatory-321 ( )14 Pancreatic cancer2814 ( )23 Preterm birth complications-7814 ( )24 Prostate cancer7234 Prostate cancer42 ( )7 Road injury-2855 ( )4 Self-harm-1723 ( )13 Stomach cancer-30314 ( )
5 2 Stroke4 Ranks for top 25 causes of YLLs 1990-2010, SerbiaCCCommuni cabl e, maternal , neonatal , and nutri ti onalCCNon-communi cabl eCCInj uri es050,000100,000150,000 YLDs0 6 days7 27 days28 364 days1 4 years5 9 years10 14 years15 19 years20 24 years25 29 years30 34 years35 39 years40 44 years45 49 years50 54 years55 59 years60 64 years65 69 years70 74 years75 79 years80+ yearsWar & disasterIntentional injuriesUnintentional injuriesTransport injuriesOther non communicableMusculoskeletal disordersDiabetes/urogen/blood/endoMenta l & behavioral disordersNeurological disordersDigestive diseasesCirrhosisChronic respiratory diseasesCardio & circulatory diseasesCancerOther communicableNutritional deficienciesNeonatal disordersMaternal disordersNTD & malariaDiarrhea/LRI/other infectiousHIV/AIDS & tuberculosisISCHEMIC HEART DISEASESTROKELOW BACK PAINANXIETY DISORDERSLUNG
6 CANCERDIABETESMAJOR DEPRESSIVE DISORDERCOPDROAD INJURYFALLSSELF-HARMOTHER MUSCULOSKELETALNECK PAINCOLORECTAL CANCEROSTEOARTHRITISOTHER CARDIO & CIRCULATORYMIGRAINEHYPERTENSIVE HEART DISEASEBREAST CANCEROTHER HEARING LOSSCHRONIC KIDNEY DISEASEDRUG USE DISORDERSALCOHOL USE DISORDERSALZHEIMER'S DISEASECIRRHOSIS1 2 345 6789101112 13 14 151617 18 19 20 21 22 23 24 25-100-80-60-40-20020406080100 | GBD | page 2 Percent change 1990-2010 YEARS LIVED WITH DISABILITY (YLDs)Years lived with disability (YLDs) are estimated by weighting the prevalence of different conditions based on severity. The top five leadingcauses of YLDs in SERBIA are low back pain, anxiety disorders, major depressive disorder, falls, and diabetes size of the coloredportion in each barrepresents the number ofYLDs attributable to eachcause.
7 The height of each barshows which age groups hadthe most YLDs in 2010. Thecauses are aggregated. Forexample, musculoskeletaldisorders include low backpain and neck YLDs by cause and age 2010 DISABILITY-ADJUSTED LIFE YEARS (DALYs)Disability-adjusted life years (DALYs) quantify both premature mortality (YLLs) and disability (YLDs) within a population. In SERBIA , the topthree causes of DALYs in 2010 were ischemic heart disease, cerebrovascular disease, and low back pain. The only cause to appear in the10 leading causes of DALYs in 2010 and not 1990 was top 25 causes of DALY sare ranked from left to rightin order of the number ofDALYs they contributed in2010. Bars going up show thepercent by which DALYs haveincreased since 1990.
8 Barsgoing down show the percentby which DALYs havedecreased. Globally,non-communicable diseasesand injuries are generally onthe rise, while communicable,maternal, neonatal, andnutritional causes of DALY sare generally on the causes of DALYs and percent change 1990 to 2010 for | GBD | page 3 101234567891011121314151617181920% DALYs attributable to risk factorsIntimate partner violenceIron deficiencyLeadDrug useAlcohol useOccupational risksHigh total cholesterolAmbient PM pollutionHousehold air pollutionHigh fasting plasma glucosePhysical inactivityHigh body mass indexSmokingHigh blood pressureDietary risksWar & disasterIntentional injuriesUnintentional injuriesTransport injuriesOther non communicableMusculoskeletal disordersDiabetes/urogen/blood/endoMenta l & behavioral disordersNeurological disordersDigestive diseasesCirrhosisChronic respiratory diseasesCardio & circulatory
9 DiseasesCancerOther communicableNutritional deficienciesNeonatal disordersMaternal disordersNTD & malariaDiarrhea/LRI/other infectiousHIV/AIDS & tuberculosisAge-standardized death rates, YLL rates, YLD rates, and life expectancy at birth and health-adjusted life expectancy at birth for 1990 and 2010, both sexes combinedCountryAge-standardized death rate(per 100,000)Age-standardized YLL rate(per 100,000)Age-standardized YLD rate(per 100,000)Life expectancy at birthHealth-adjusted lifeexpectancy at birth19902010199020101990201019902010199 02010 Rate Rank Rate Rank Rate Rank Rate Rank Rate Rank Rate Rank LE Rank LE Rank HALE Rank HALE RankGrenada9041185013 25,983 9 21,313 13 13,149 13 13,076 14 107113 ,043 14 1,043 14 31,524 14 29,881 14 11,955 5 11,587 14 Costa Rica55614621 13,705 1 10,447 1 11,672 2 10,948 23,494 8 16,325 7 11,261 1 11,043 16,812 4 14,027 6 12,186 8 11,151 29,033 13 16,780 9 13,288 15 12,619 26.
10 370 10 17,580 10 12,016 6 11,637 16,985 5 12,077 3 12,440 10 11,833 7 5 3636663 South Africa1,133 15 1,266 15 34,540 15 48,286 15 12,905 12 13,826 15 15,919 2 11,088 2 11,765 3 12,791 16,059 3 13,549 4 12,222 9 12,180 27,022 12 20,892 12 12,827 11 12,945 12 12 11 11 Jamaica67656105 18,618 6 16,417 8 12,075 7 12,909 11 10 Macedonia87386829 21,414 7 13,939 5 11,940 4 11,694 Vincent and theGrenadines890975312 26,567 11 20,602 11 13,233 14 13,056 13 12 12 RISK FACTORSO verall, the three risk factors that account for the most disease burden in SERBIA are dietary risks, high blood pressure, and tobaccosmoking.