Transcription of GBD PROFILE: ZAMBIA
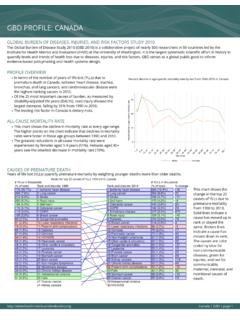
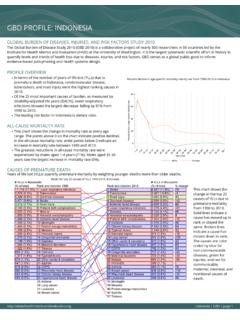
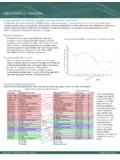
1 global burden OF DISEASES, INJURIES, AND RISK FACTORS STUDY 2010 The global burden of Disease Study 2010 (GBD 2010) is a collaborative project of nearly 500 researchers in 50 countries led by theInstitute for Health Metrics and Evaluation (IHME) at the University of Washington. It is the largest systematic scientific effort in history toquantify levels and trends of health loss due to diseases, injuries, and risk factors. GBD serves as a global public good to informevidence-based policymaking and health systems OVERVIEWlIn terms of the number of years of life lost (YLLs) due topremature death in ZAMBIA , HIV/AIDS, malaria, and lowerrespiratory infections were the highest ranking causes in the 25 most important causes of burden , as measured bydisability-adjusted life years (DALYs), diarrheal diseases showedthe largest decrease, falling by 32% from 1990 to leading risk factor in ZAMBIA is childhood MORTALITY RATElThis chart shows the change in mortality rate at every agerange.
2 The points above 0 on the chart indicate positive declinesin the all-cause mortality rate, while points below 0 indicate anincrease in mortality rate between 1990 and greatest reductions in all-cause mortality rate wereexperienced by females aged 1-4 years (55%). Males aged 60-64years saw the largest increase in mortality rate (5%).Percent decline in age-specific mortality rate by sex from 1990-2010 in ZambiaCAUSES OF PREMATURE DEATHY ears of life lost (YLLs) quantify premature mortality by weighting younger deaths more than older chart shows thechange in the top 25causes of YLLs due topremature mortalityfrom 1990 to lines indicate acause has moved up inrank or stayed thesame. Broken linesindicate a cause hasmoved down in causes are colorcoded by blue fornon-communicablediseases, green forinjuries, and red forcommunicable,maternal, neonatal, andnutritional causes PROFILE: | GBD | page 1015304560 Percent decline in age specific mortality rate 1 45 910 1415 1920 2425 2930 3435 3940 4445 4950 5455 5960 6465 6970 7475 7980+Age groupMalesFemales# YLLs in thousands(% of total)Rank and disorder 1990 Rank and disorder 2010# YLLs in thousands(% of total)% change46 ( )23 Cirrhosis89 ( )14 Congenital anomalies756 ( )4 Diarrheal diseases65 ( )18 Drowning50 ( )22 Epilepsy56 ( )20 Falls99 ( )13 Fire1,067 ( )1 HIV/AIDS38 ( )24 Interpersonal violence54 ( )21 Ischemic heart disease818 ( )3 Lower respiratory infections1,097 ( )2 Malaria69 ( )16 Maternal disorders73 ( )17 Measles26 Measles351 ( )6 Meningitis177 ( )8 Neonatal encephalopathy121 ( )12 Neonatal sepsis64 ( )19 Poisonings134 ( )10 Preterm birth complications583 ( )5 Protein-energy malnutrition129 ( )11 Road injury33 ( )25 Self-harm79 ( )15 Stroke177 ( )9 Syphilis184 ( )7 Tuberculosis68 ( )22 Cirrhosis4884 ( )17 Congenital anomalies-748 ( )
3 25 Diabetes7926 Diabetes500 ( )4 Diarrheal diseases-3477 ( )18 Drowning2075 ( )19 Epilepsy5098 ( )15 Falls69105 ( )14 Fire71,745 ( )1 HIV/AIDS6475 ( )20 Interpersonal violence9881 ( )16 Ischemic heart disease50688 ( )3 Lower respiratory infections-161,155 ( )2 Malaria576 ( )21 Maternal disorders-5403 ( )6 Meningitis13279 ( )7 Neonatal encephalopathy55210 ( )10 Neonatal sepsis7760 ( )23 Poisonings-7194 ( )11 Preterm birth complications46474 ( )5 Protein-energy malnutrition-21146 ( )12 Road injury1454 ( )24 Self-harm64128 ( )13 Stroke60269 ( )8 Syphilis52247 ( )9 Tuberculosis33 Ranks for top 25 causes of YLLs 1990-2010, ZambiaCCCommuni cabl e, maternal , neonatal , and nutri ti onalCCNon-communi cabl eCCInj uri es050,000100,000150,000 YLDs0 6 days7 27 days28 364 days1 4 years5 9 years10 14 years15 19 years20 24 years25 29 years30 34 years35 39 years40 44 years45 49 years50 54 years55 59 years60 64 years65 69 years70 74 years75 79 years80+ yearsWar & disasterIntentional injuriesUnintentional injuriesTransport injuriesOther non communicableMusculoskeletal disordersDiabetes/urogen/blood/endoMenta l & behavioral disordersNeurological disordersDigestive diseasesCirrhosisChronic respiratory diseasesCardio & circulatory diseasesCancerOther communicableNutritional deficienciesNeonatal disordersMaternal disordersNTD & malariaDiarrhea/LRI/other infectiousHIV/AIDS & tuberculosisHIV/AIDSMALARIALOWER RESPIRATORY INFECTIONSDIARRHEAL DISEASESPROTEIN-ENERGY MALNUTRITIONMENINGITISNEONATAL ENCEPHALOPATHYTUBERCULOSISSYPHILISPRETER M BIRTH COMPLICATIONSNEONATAL SEPSISROAD INJURYIRON-DEFICIENCY ANEMIASTROKEMAJOR DEPRESSIVE DISORDEREPILEPSYFIREFALLSCONGENITAL ANOMALIESISCHEMIC
4 HEART DISEASEMATERNAL DISORDERSLOW BACK PAINDROWNINGINTERPERSONAL VIOLENCECOPD1 23 4 56 7 8 9 10 11 12 13 14 15 16 17 181920 21 22 23 24 25-100-80-60-40-20020406080100 | GBD | page 2 Percent change 1990-2010 YEARS LIVED WITH DISABILITY (YLDs)Years lived with disability (YLDs) are estimated by weighting the prevalence of different conditions based on severity. The top five leadingcauses of YLDs in ZAMBIA are iron-deficiency anemia, major depressive disorder, HIV/AIDS, low back pain, and chronic obstructivepulmonary size of the coloredportion in each barrepresents the number ofYLDs attributable to eachcause. The height of each barshows which age groups hadthe most YLDs in 2010. Thecauses are aggregated. Forexample, musculoskeletaldisorders include low backpain and neck YLDs by cause and age 2010 DISABILITY-ADJUSTED LIFE YEARS (DALYs)Disability-adjusted life years (DALYs) quantify both premature mortality (YLLs) and disability (YLDs) within a population.
5 In ZAMBIA , the topthree causes of DALYs in 2010 were HIV/AIDS, malaria, and lower respiratory infections. The only cause to appear in the 10 leading causesof DALYs in 2010 and not 1990 was preterm birth top 25 causes of DALY sare ranked from left to rightin order of the number ofDALYs they contributed in2010. Bars going up show thepercent by which DALYs haveincreased since 1990. Barsgoing down show the percentby which DALYs havedecreased. Globally,non-communicable diseasesand injuries are generally onthe rise, while communicable,maternal, neonatal, andnutritional causes of DALY sare generally on the causes of DALYs and percent change 1990 to 2010 for | GBD | page 3012345678% DALYs attributable to risk factorsHigh body mass indexUnimproved waterZinc deficiencySanitationHigh fasting plasma glucoseVitamin A deficiencyOccupational risksAlcohol useSmokingIron deficiencyDietary risksHigh blood pressureSuboptimal breastfeedingHousehold air pollutionChildhood underweightWar & disasterIntentional injuriesUnintentional injuriesTransport injuriesOther non communicableMusculoskeletal disordersDiabetes/urogen/blood/endoMenta l & behavioral disordersNeurological disordersDigestive diseasesCirrhosisChronic respiratory diseasesCardio & circulatory diseasesCancerOther communicableNutritional deficienciesNeonatal disordersMaternal disordersNTD & malariaDiarrhea/LRI/other infectiousHIV/AIDS & tuberculosisAge-standardized death rates, YLL rates, YLD rates.
6 And life expectancy at birth and health-adjusted life expectancy at birth for 1990 and 2010, both sexes combinedCountryAge-standardized death rate(per 100,000)Age-standardized YLL rate(per 100,000)Age-standardized YLD rate(per 100,000)Life expectancy at birthHealth-adjusted lifeexpectancy at birth19902010199020101990201019902010199 02010 Rate Rank Rate Rank Rate Rank Rate Rank Rate Rank Rate Rank LE Rank LE Rank HALE Rank HALE RankKenya1,092 21,013 5 39,731 2 36,153 6 13,184 3 12,884 ,22348724 45,244 4 26,770 4 14,698 8 13,715 ,508 11 1,389 11 67,610 12 58,839 12 15,080 13 14,364 13 ,3127 1,080 7 58,713 10 38,726 7 15,237 14 13,830 ,185 3 1,0306 45,628 5 35,128 5 14,555 7 13,298 ,29568643 49,258 6 26,361 3 14,743 9 13,206 ,31682,130 14 43,569 3 85,888 14 13,503 4 15,483 14 14 Zambia1,722 15 1,533 13 73,053 14 57,620 11 15,030 11 13.
7 732 14 11 14 11 North Korea89518322 25,915 1 21,755 1 10,569 1 10,347 ,717 14 3,321 15 61,823 11 137,295 15 15,059 12 16,428 15 ,35791,1378 55,603 9 43,461 9 14,553 6 14,177 12 ,285 58321 49,745 7 26,361 2 13,660 5 12,959 ,439 10 1,2239 52,340 8 38,959 8 13,050 2 12,879 Faso1,521 12 1,396 12 68,852 13 59,507 13 14,862 10 13,409 ,658 13 1,290 10 75,253 15 45,587 10 15,596 15 13,882 11 15 10 RISK FACTORSO verall, the three risk factors that account for the most disease burden in ZAMBIA are childhood underweight, household air pollutionfrom solid fuels, and suboptimal breastfeeding. The leading risk factors for children under 5 and adults aged 15-49 years were childhoodunderweight and alcohol use, respectively, in graph shows the top 15risk factors for ZAMBIA .
8 Thecolored portion of each barrepresents the specificdiseases attributable to thatrisk factor while bar sizerepresents the percentage ofDALYs linked to specific of disease attributable to 15 leading risk factors in 2010, expressed as a percentage of ZAMBIA DALYsCOUNTRY BENCHMARKING OF burden OF DISEASEU nderstanding the relative performance of ZAMBIA against other comparator countries provides key insight into public health successesand areas where ZAMBIA might be falling behind. The table identifies ZAMBIA 's rank across 14 other comparator countries, selected andordered by income per capita, for five metrics of interest, with 1 indicating the best rank and 15 indicating the worst rates are used to make meaningful comparisons across time by adjusting for changes in population size and expectancy incorporates mortality, and health-adjusted life expectancy further incorporates years lived in less than ideal 2010, ZAMBIA ranked 9th for age-standardized YLD rate and 13th for age-standardized death | GBD | page 4 Ranking of leading age-standardized rates of disability-adjusted life years (DALYs)
9 Relative to comparator countries in 1990 CountryKenya8982984357596526536873542 Timor-Leste16955612243112142145118213114 2159 Chad771415141296126101310103146131214312 968 Benin11121361311211612131479713714141581 1787 Ghana10104369382491511341194101217393 Bangladesh143981514721542410915451513151 14 Lesotho61282415781834811413273418712 Zambia14 14 7 7 15 13 11 10 13 13 1 6 15 15 5 2 10 7 13 4 12 15 14 11 5 North Korea321112111921311511211114841213 Haiti9551331013914871286815151152261141 Tanzania12151110105851010375111104109692 1134 Nepal5312124310159512517138363759131015 Comoros486411761215151410913123141511101 3561311 Burkina Faso131315147157431461112129122915961410 210 Uganda1511101112141413111148131467812811 10101256 Ranking of leading age-standardized rates of disability-adjusted life years (DALYs) relative to comparator countries in 2010 CountryKenya1171110129387610874967452647 52 Timor-Leste16444421339223912323151585969 Chad101115151514811141314131468151213105 1513577 Benin71412610126451113913741169781010484 Ghana91073910522815710106103761341326 Bangladesh342251153615316135411942151531 4 Lesotho152131336131591443414137141146136 81513 Zambia14 13 9 11 14 13 11 12 15 2 7 11 2 11 10 12 13 15 4 10 7 3 13 12 5 North Korea411112111115112111813121812412 Haiti65612687101171261515749101114522141 Tanzania13987859712361011214882111411111 13 Nepal53392314685545322553113141115 Comoros281081171291312914913111311687129 141011 Burkina Faso815141413154541011151285141514129976 910 Uganda1212557111014104812851591012231112 10138 Ranking Legend1 - 34 - 78 - 1112 - 15 HIV/AIDSM alariaLower respiratory infectionsDiarrheal diseasesProtein-energy malnutritionMeningitisTuberculosisNeonat al encephalopathySyphilisRoad
10 InjuryPreterm birth complicationsNeonatal sepsisMajor depressive disorderFireCongenital anomaliesIron-deficiency anemiaStrokeMaternal disordersEpilepsyMeaslesDrowningFallsPoi soningsIschemic heart diseaseCOPDHIV/AIDSM alariaLower respiratory infectionsDiarrheal diseasesProtein-energy malnutritionMeningitisNeonatal encephalopathyTuberculosisSyphilisPreter m birth complicationsNeonatal sepsisRoad injuryIron-deficiency anemiaStrokeMajor depressive disorderEpilepsyFireFallsCongenital anomaliesIschemic heart diseaseMaternal disordersLow back painDrowningInterpersonal violenceCOPDCOUNTRY BENCHMARKING OF burden OF DISEASE, CONTINUEDThis figure shows the rank of ZAMBIA relative to the same comparator countries for the leading causes of DALYs in 1990 (top) and 2010(bottom).lThe columns are ordered by the absolute number of DALYs in ZAMBIA for that particular year, with greatest burden on the numbers indicate the rank across countries for each cause in terms of age-standardized DALY rates, with 1 as the bestperformance and 15 as the for Health Metrics and Evaluation2301 Fifth Ave.