Transcription of GIRLS Please place sticker (if available) otherwise write ...
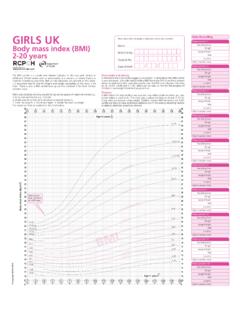
1 Growth patterns before and during pubertySuccessive height measurements can show wide variation,because it is difficult to measure height accurately. If there areconcerns it is useful to measure on a few occasions over growth during puberty is complex because the agewhen puberty starts does a height in the shaded area below the mean?This chart provides some extra guidance about the lower limit( centile) for height in GIRLS 8-13 years. If a plot falls withinthe shaded area on the height chart between 8 and 13 years,pubertal assessment will be required and mid-parental centileshould be they are Inpuberty or Completingpuberty, they are belowthe centile and should be referred.
2 In most instances a Pre-pubertal girl plotted in this area is growing normally, butcomparison with the mid-parental centile and growth trajectorywill assist the assessment of whether further investigation weight is above the 75th centile or ifweight and height centiles differ, the BMIcentile should be calculated, as the BMIcentile is the best indicator of thinness andfatness. The BMI look-up allows you to readoff the BMI centile, accurate to a quarter of acentile space. There is a BMI centile grid atthe top of the growth chart where thecentiles for children with high or low valuescan be for use1.
3 Note the weight and height centiles fromthe growth Plot the weight centile against the heightcentile on the the BMI If between centiles, read across in Read off the corresponding BMI centilefrom the pink slanting Plot the centile in the BMI grid at the topof the growth chart at the Height PredictorThis allows you to predict the child s adult height based ontheir current height, but with a regression adjustment toallow for the tendency of very tall and short children to beless extreme in height as adults. Four GIRLS out of five willhave an adult height within 6 cm of the predicted for usePlot the most recent height centile on the centile line on theAdult Height Predictor (on the flap to the right of the heightcentile chart) and read off the predicted adult height for CentileThe mid-parental centile is the average adult height centileto be expected for all children of these parents.
4 Itincorporates a regression adjustment to allow for thetendency of very tall and short parents to have children withless extreme heights. Comparing this to the child s currentheight centile can help assess whether the child s growth isproceeding as expected. The larger the discrepancy betweenthe two, the more likely it is that the child has some sort ofgrowth disorder. Most children s height centiles (nine out often) are within two centile spaces of the mid-parentalcentile, and only 1 percent will be more than three centilespaces below.
5 Instructions for useThe Mid-parental Centile Comparator is on the flap to theright of the height centile chart. If possible measure bothparents heights, or else use reported heights. Plot theirheights on the Mother s and Father s height scales. Join thetwo points with a line between them. The mid-parentalcentile is where this line crosses the centile line in the the mid-parental centile to the child s currentheight centile, plotted on the adult height predictor target heightThis can be obtained by plotting the mid-parental centile onthe main chart at age 18 and reading off the correspondingheight.
6 Four GIRLS out of five will have an adult height within 7 cm of this target height. However the predicted adultheight (above) is usually closer than mid-parental targetheight to the child s final place sticker (if available ) otherwise write in space :_____NHS/CHI No:Hospital No:Date of Birth:GIRLSUK Growth chart2-18 yearsAnyone who measures a child, plots or interprets chartsshould be suitably trained or supervised. For furtherinformation and training materials see fact sheet andpresentation on chart is mainly intended to assess the growth of schoolage GIRLS .
7 It combines data from the UK 1990 growthreference for children at birth and from 4 -18 years(1), withthe WHO growth standard for children aged 2 years to 4years(2). The growth of children under 2 years of age shouldbe plotted on the more detailed UK-WHO 0-4 years well as simply using this chart for plotting growth data, italso includes a number of new features which you may wishto use to help interpret the growth data. birth centile plotting scale BMI look-up and plotting grid scales to estimate adult height and mid-parental centile guide to assessing pubertyPlottingPlot each measurement by placing a small dot where avertical line through the child s age crosses a horizontal linethrough the measured lettering on the charts ( weight , length etc.)
8 Sits on the50th centile to provide centile plotting scaleThe chart starts at age 2 years, but there is a plotting scale onthe left of the chart where for term infants, birth weight (andif measured, length) can be plotted to allow comparison ofthe birth centile with later Freeman JV, Cole TJ, Chinn S, Jones PRM, White EM, Preece MA. Cross sectional stature and weight reference curves for the UK, 1990. Arch Dis Child 1995; 73 further relevant references see fact sheet downloadable from Copyright RCPCH 2012 Manufacture 4 Jan. 13 UK2-18A4G Issue 2 Harlow Printing Limited Tel.
9 0191 455 4286 PubertyCompleting Puberty(Tanner stage 1)(Tanner stages 2-3)(Tanner stages 4-5)No signs of pubertal Any breast enlargementStarted periods with signsdevelopmentpubic or armpit hairof pubertal developmentData Recording Recording DateWeightLength/HeightLocationHealth worker nameMeasurement 1 Measurement 2 Recording DateWeightLength/HeightLocationHealth worker nameRecording DateWeightLength/HeightLocationHealth worker nameMeasurement 3 Measurement 4 Recording DateWeightLength/HeightLocationHealth worker nameRecording DateWeightLength/HeightLocationHealth worker nameMeasurement 5 Measurement 6 Recording
10 DateWeightLength/HeightLocationHealth worker nameRecording DateWeightLength/HeightLocationHealth worker nameMeasurement 7 Measurement 8 Recording DateWeightLength/HeightLocationHealth worker nameRecording DateWeightLength/HeightLocationHealth worker nameMeasurement 9 Measurement 10 Recording DateWeightLength/HeightLocationHealth worker name months monthsCentile terminologyIf the point is within 1/4 of a space ofthe line they are on the centile: not they should be described asbeing between the two 75th centile space is the distance betweentwo of the centile lines, or equivalentdistance if midway between Overweight (Obese)Overweight 99 rwrwrwBBMethhtgghiiggeeiwreervOOv)ee)sse eesbOOb((OthhtighiigeeiwreervOOvellleiii ltttinnnteeenccceIMMMIB02929e)e)htht(O(O ererwweieigigilileleOMIMIcMOeMeOweewlgtl tghghewO)bb)