Transcription of GIS -06 : SPATIAL ANALYSIS (1)- Overlay Operations ...
1 GIS -06 : SPATIAL ANALYSIS (1)-_ Overlay Operations &. ANALYSIS in GIS. SUBJECT GEOGRAPHY. PAPER REMOTE SENSING, GIS and GPS. MODULE SPATIAL ANALYSIS (2) : Overlay Operations & ANALYSIS in GIS. Module ID RS/GIS- 24. Development Team Principal Investigator Prof. Masood Ahsan Siddiqui Jamia Millia Islamia, New Delhi Paper Coordinator Dr Punia BITS , Jaipur Content Writer Dr Seema Mehra Parihar Kirori Mal College, University of Delhi, Delhi Content Reviewer Prof. Masood Ahsan Siddiqui Jamia Millia Islamia, New Delhi GIS-06: SPATIAL ANALYSIS (1)- Overlay Operations & ANALYSIS in GIS. Learning objective In this chapter you will learn the following: Understand the concept of SPATIAL Anaysis in Geospatial Environment;. Conceptualise Overlay ANALYSIS in GIS;. Comprehend the importance, uses and essential characteristics of Overlay ANALYSIS ; and Be able to visualise the role of vector and raster data model in these ANALYSIS .
2 1. INTRODUCTION. SPATIAL ANALYSIS is the vital part of GIS. We have learned in the previous chapters that these can be done in two ways. One is the vector-based and the other is raster based ANALYSIS . Since the advent of GIS in the 1960s, many government agencies have invested heavily in GIS installations, including the purchase of hardware and software and the construction of mammoth databases. As aptly stated by Raju, ,2015, two fundamental functions of GIS have been widely realized: generation of maps and generation of tabular reports . Indeed, GIS provides a very effective tool for generating maps and statistical reports from a database. However, GIS. functionality far exceeds the purposes of mapping and report compilation. In addition to the basic functions related to automated cartography and data base management systems, the most important uses of GIS are SPATIAL ANALYSIS capabilities.
3 As SPATIAL information is organized in a GIS, it should be able to answer complex questions regarding space. Indeed, functions required for performing SPATIAL analyses that are not available in either cartographic packages or data base management systems are commonly implemented in GIS. 2. USING GIS FOR SPATIAL ANALYSIS . SPATIAL ANALYSIS in GIS involves three types of Operations : i. Attribute Queryalso known as non- SPATIAL (or SPATIAL ) query, ii. SPATIAL Query and iii. Generation of new data sets from the original database (Bwozough, 1987). 3. GIS Usage in SPATIAL ANALYSIS GIS can interrogate geographic features and retrieve associated attribute information, called identification. It can generate new set of maps by query and ANALYSIS . It also evolves new information by SPATIAL Operations . Here are described some analytical procedures applied with a GIS. GIS operational procedure and analytical tasks that are particularly useful for SPATIAL ANALYSIS include: Single layer Operations Multi layer Operations / Topological Overlay SPATIAL modeling Geometric modeling Calculating the distance between geographic features Calculating area, length and perimeter Geometric buffers.
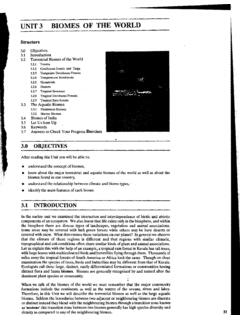
4 Point pattern ANALYSIS Network ANALYSIS Surface ANALYSIS Raster/Grid ANALYSIS Fuzzy SPATIAL ANALYSIS Geostatistical Tools for SPATIAL ANALYSIS 4. Overlay ANALYSIS Overlay ANALYSIS is operation in GIS for superimposing the multiple layer of datasets that representing different themes together for analysing or identifying relationship of each layer. Overlay ANALYSIS represent the composite map by the combination of different attribute and geometry of datasets or entity. Overlay is the Operations of comparing variables among multiple coverages. In the Overlay ANALYSIS new SPATIAL data sets are created by merging data from two or more input data layers. Overlay ANALYSIS is one of the most common and powerful GIS technique. It analyses the multiple layer with common coordinate systems and determine what is on the top layer. Overlay Operations combine the data from same entity or different entities and create the new geometries and new unit of change entity (figure 1).
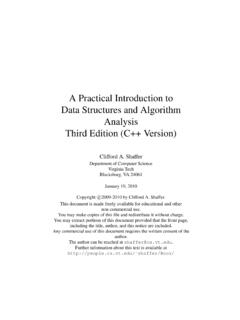
5 Figure 1 : Overlay ANALYSIS Overlay Operations performs many type of ANALYSIS for example cropping pattern in the field, dominance of particular ethnic population in a region, age and sex composition of region, physical landforms of the surface. Suppose I have to find the potential park sites of population so I will create the map of density of population and the map of distance to parks of populated area then I will superimpose the both layer and find the suitable location. Figure 2 : The data structure in Overlay ANALYSIS comprises the connection of thematic and geometric information It is also termed as SPATIAL Overlay because it is accomplished by joining and viewing together separate data sets that share all or part of the same area (figure 2). The result of this combination is a new data set that identifies the SPATIAL relationships. Before the use of computers, a similar effect was developed by Ian McHarg and others by drawing maps of the same area at the same scale on clear plastic and actually laying them on top of each other.
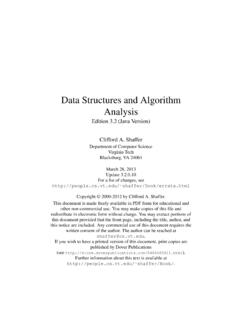
6 Map Overlay is used in both model Overlay of vector data and Overlay of raster data . Figure 3: Overlays of multiple Layers resulting in LULC MAP. There are four Overlay operators in common use: 1. Point-in-area (also known as point in polygon). 2. Line-in-area (also known as line in polygon). 3. Area-on-area (also known as polygon on polygon). 4. Weighted Overlay Vector based Overlay Overlay of vector data combine point, line, and polygon features. In this data model Operations rely on geometry and topology of surface. Vector based Overlay is time consuming, complex and computationally expensive. For example taking the ordering network layer of Ganga Watershed and laying over it with the layer of village. The result would be which orders of stream of Ganga flow in which village. Point-in-polygon Point in Polygon Overlay (figure 4) operation will also generate combinative properties of point attributes of one layer and the polygon attribute of the ANALYSIS layer.
7 It is a SPATIAL operation in which one point coverage is overlaid with polygon coverage to determine which points falls within the polygon boundaries. After Overlay operation, points assume the attributes of the polygons within which they fall. It helps in formulating hypothesis about the SPATIAL relationships between the occurrence of points and the attributes of the polygons. This kind of Overlay operation can also be used to calculate number of points located in each of the polygon. Figure 4:Point in polygon Polygon on polygon Overlay Operations In the polygon on polygon Overlay Operations (figure 5) I need to check before starting the input layer it should topologically correct. If it is correct output map will also correct. In the polygon Overlay it is essential to add new intersections and create polygon for new topology. The Overlay of 2 layers of polygon will produce large number of polygons and increase the number of intersections zone and arcs.
8 If the new polygon, arcs and set of nodes have been shaped then meaningful set of layer can be extract. It is necessary to keep in mind that area should be common to both input features. Figure 5: Polygon on polygon Overlay Operations For example, a farmer wants to know which part of field has loam soil for the cultivation of crops. The farmer will Overlay the map of loam soil polygons on field polygon to extract a feature that meets both criteria loam soil and in-field' for the cultivation of crops. The variables is processed by the farmer, both are categorical or nominal data type. Mathematician have developed set of algorithms, termed as Boolean operators for handling with this type of data and GIS analysts exploit in area on area Overlay ANALYSIS . Boolean operators is the base of polygon Overlay when it apply for vector data due to discrete area objects and nominal attributes.
9 Line in area Overlay Operations Line in area Overlay Operations (figure 6)need to check linear object or attribute which will combine or meagre with area layer. It should be also topological correct. Suppose I have to know about which road is going in forest are or non- forest. Simply I need to Overlay the line layer on polygon, remaining extracted layer will be result. Figure 6: Line in area Overlay Operations Point in area Overlay Operations In this type of Operations (figure 7) need to check the point attribute or object that superimpose on area. For example I have to know location of met station in forest or non-forest area. It is simply done by overlaying the point layer on area layer. Figure 7: Point in area Overlay Operations Weighted Overlay and the vector data model The objective behind area-on-area Overlay on a vector data model, to identify one or more parts of the new geometry that met simple criteria.
10 Areas that did not meet the criteria were discarded . This was processed as a single task. The function of weighted Overlay is to determine a new set of values for the complete coverage based on a combination of input values. There are two task to perform that working with a vector data model. 1. Create a new set of geometries for the entire area and 2. Compute a new set of attributes for those geometries. After performing the above mention task is a matter of describing a mathematical equation to process the input values. In the first task requires you to extend the basic polygon Overlay operation to consider every intersection between all polygons in every data layer. As you can imagine this can be computationally demanding, especially if the GIS you are using computes topology 'on the fly' and does not store it in the data structure. As we shall see this is one of the reasons why weighted Overlay is more frequently applied to a raster data model.