Transcription of Global Insight, Global Connections
1 A division of the Georgia Department of Economic development | 75 Fifth Street, NW, Suite 1200, Atlanta, GA 30308 - USA | Department of Economic development | Technology Square | 75 Fifth Street, NW, Suite 1200, Atlanta, GA 30308 - USA | (+1) | Insight, Global Connections2017 International trade Numbers report 2 2017 Georgia International trade Summary Georgia maintains international presence in 11 strategic Global markets - Brazil, Canada, Chile, China, Colombia, Europe, Israel, Japan, Korea, Mexico and the United Kingdom and Ireland. With more than 14,500 exporters in the state, this worldwide representation helps keep Georgia globally competitive by offering companies unparalleled access to Global insights and Connections . Georgia is the 12th largest exporting state in the nation, with 67% of exports and 78% of total trade involving markets where the state has representation.
2 In 2017, total trade between Georgia and the world reached 225 unique countries and territories, exceeding a record breaking $ billion.* In the past 10 years, this trade has grown by 53%. Georgia now ranks 8th in the for total trade . Georgia exports increased by 4% exceeding $ billion and reaching 215 countries and territories worldwide. Canada, Mexico and China remained Georgia s top export markets, and all showed positive growth in 2017. Georgia has international representation in 8 of the top 10 export markets and the dollar value of exports to all countries covered by Georgia s international representatives totaled $ billion. Notably, India moved into the top 10 export markets for the first time with a 167% increase in exports totaling more than $1 billion. Other key export markets with significant growth in 2017 include The Netherlands (36% increase), Germany (17%), China (9%) and Singapore (8%).
3 Aerospace remained the leading export industry for Georgia in 2017 with exports totaling more than $ billion, a 4% single year increase largely due to powered aircraft exports to India. Poultry exports from Georgia grew by more than 22% in 2017 and totaled $ billion. Exports of medical devices and pharmaceuticals exceeded $ billion worldwide, and Belgium remained the top export market for the 7th year in a row. Additionally, Georgia continued to lead the nation in the export of chemical woodpulp, Kraft paper and paperboard, poultry, kaolin and carpets. Collectively, Georgia s top 10 export industries accounted for 72% of Georgia s total exports, and the top 5 alone accounted for 54%. Imports also play an important role in the Global trade story, and Georgia maintained its rank as 7th in the nation based on dollar value of imports for the 4th consecutive year.
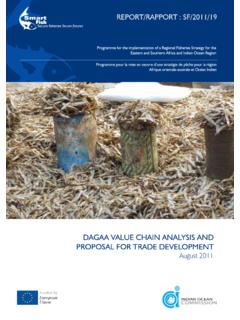
4 The value of imports exceeded $ billion, and notably, imports from 17 different countries exceeded more than $1 billion. The top 10 import industries accounted for 70% of Georgia s imports, the top 5 alone accounted for 56%. The leading import industry for Georgia was non-railway vehicles, followed closely by heavy and electrical machinery. Georgia s top 5 import markets in 2017 were China, Germany, Mexico, Korea and Japan. * Total trade is the sum of exports and imports Data Source: Global trade Atlas; based on origin of movement. Service sector export data not available at state level. Georgia Exports Data Source: Global trade Atlas; prepared by Georgia Department of Economic development Georgia's Top Export Markets 2017 2017 Rank Country 2013 2014 2015 2016 2017 % of Total % 17/16 World $ $ $ $ $ 100% 4% 1 Canada $ $ $ $ $ 16% 5% 2 Mexico $ $ $ $ $ 9% 2% 3 China $ $ $ $ $ 7% 9% 4 Germany $ $ $ $ $ 5% 17% 5 Singapore $ $ $ $ $ 3% 8% 6 Japan $ $ $ $ $ 3% -3% 7 United Kingdom $ $ $ $ $ 3% -4% 8 India $ $ $ $ $ 2% 167% 9 The Netherlands $ $ $ $ $ 2% 36% 10 Korea $ $ $ $ $ 2% -11% Data Source: Global trade Atlas; prepared by Georgia Department of Economic development $0$1$2$3$4$5$6$7 Dollar Value of ExportsBillionsGeorgia's Top Export Markets 2017201320142015201620173 Georgia's Top Export Industries 2017 Data Source: Global trade Atlas.
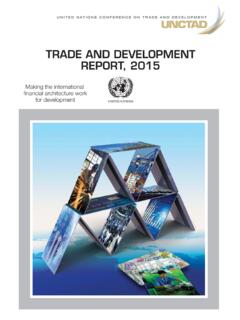
5 Prepared by Georgia Department of Economic development Georgia's Top Export Industries 2017 Data Source: Global trade Atlas; prepared by Georgia Department of Economic development DataSource:GlobalTrade Atlas;preparedbyGeorgiaDepartmentof EconomicDevelopmentGeorgia s Top Export Industries 2017 Aircraft/ SpacecraftHeavy MachineryElectrical MachineryVehicle, Non RailwayOptic/MedicalInstrumentsPaper andPaperboardWoodpulp, $ $ $ $ $ $ $ $ $ $ :GlobalTrade Atlas;preparedbyGeorgiaDepartmentof EconomicDevelopment$0$1$2$3$4$5$6$7$8$9$ 10 Aerospace, DefenseandSecurityAgribusinessAutomotive MedicalDevices andPharmaceuticalsBuilding andConstructionstropxEfoeulaVralloDBilli onsExport Growth of Georgia's Strategic Industries200820174 Georgia Total trade Data Source: Global trade Atlas; prepared by Georgia Department of Economic development Georgia's Top Trading Partners 2017: Total trade 2017 Rank Country 2013 2014 2015 2016 2017 % of Total % 17/16 World $ $ $ $ $ 100% 6% 1 China $ $ $ $ $ 19% 18% 2 Germany $ $ $ $ $ 11% -7% 3 Mexico $ $ $ $ $ 8% 4% 4 Canada $ $ $ $ $ 8% 5% 5 Korea $ $ $ $ $ 6% -2% 6 Japan $ $ $ $ $ 5% -2% 7 United Kingdom $ $ $ $ $ 4% 3% 8 India $ $ $ $ $ 2% 26% 9 France $ $ $ $ $ 2% 16% 10 Italy $ $ $ $ $ 2% 9% Data Source: Global trade Atlas; prepared by Georgia Department of Economic development $0$2$4$6$8$10$12$14$16$18$20$22$24$26 ChinaGermanyMexicoCanadaKoreaJapanUnited KingdomIndiaFranceItalyTotal trade (Exports + Imports)BillionsGeorgia's Top Trading Partners 2017201320142015201620175 Data Source: Global trade Atlas.
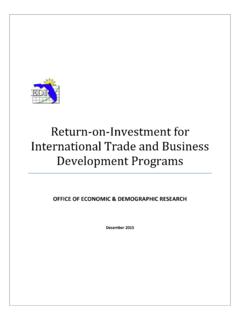
6 Prepared by Georgia Department of Economic development Georgia s Top Imports Industries 2017 Data Source: Global trade Atlas; prepared by Georgia Department of Economic development $0$20$40$60$80$100$120$14020082009201020 11201220132014201520162017 Total trade (Exports + Imports)BillionsGeorgia's Total trade with World: 2008-2017 ExportsImportsDataSource:GlobalTrade Atlas;preparedbyGeorgiaDepartmentof EconomicDevelopmentGeorgia s Top Import Industries 2017 Vehicles, Non RailwayHeavy MachineryElectrical MachineryFurniture and LightingOptic/MedicalInstrumentsPlastics PharmaceuticalProductsApparel, Not KnittedAircraft/SpacecraftApparelKnitted $ $ $ $ $ $ $ $ $ $ Data Source: Global trade Atlas; prepared by Georgia Department of Economic development Georgia's Top Import Markets 2017 2017 Rank Country 2013 2014 2015 2016 2017 % of Total % 17/16 World $ $ $ $ $ 100% 6% 1 China $ $ $ $ $ 24% 20% 2 Germany $ $ $ $ $ 13% -10% 3 Mexico $ $ $ $ $ 7% 6% 4 Korea $ $ $ $ $ 6% 5 Japan $ $ $ $ $ 5% -2% 6 Canada $ $ $ $ $ 4% 6% 7 United Kingdom $ $ $ $ $ 4% 6% 8 France $ $ $ $ $ 2% 20% 9 India $ $ $ $ $ 2% 10 Thailand $ $ $ $ $ 2% 17% Data Source: Global trade Atlas.
7 Prepared by Georgia Department of Economic development *For more information, please contact Abby Harrison, Georgia Department of Economic development trade Division, at $0$2$4$6$8$10$12$14$16$18$20$22$24 ChinaGermanyMexicoKoreaJapanCanadaUnited KingdomFranceIndiaThailandDollar Value of ImportsBillionsGeorgia's Top Import Markets 2017201320142015201620177