Transcription of GLOBAL POVERTY INDEX 2019 ILLUMINATING INEQUALITIES
1 GLOBAL MULTIDIMENSIONAL POVERTY INDEX 2019 ILLUMINATING INEQUALITIESOPHIO xford POVERTY & Human Development InitiativePrinted in the US, by the AGS, an RR Donnelley Company, on Forest Stewardship Council certified and elemental chlorine-free papers. Printed using vegetable-based a list of any errors and omissions found subsequent to printing, please visit and @ 2019By the United Nations Development Programme and Oxford POVERTY and Human Development InitiativeThe team that created this report includes Sabina Alkire, Pedro Concei o, Ann Barham, Cecilia Calder n, Adriana Conconi, Jakob Dirksen, Fedora Carbajal Espinal, Maya Evans, Jon Hall, Admir Jahic, Usha Kanagaratnam, Maarit Kivilo, Milorad Kovacevic, Fanni Kovesdi, Corinne Mitchell, Ricardo Nogales, Christian Oldiges, Anna Ortubia, M nica Pinilla-Roncancio, Carolina Rivera, Mar a Emma Santos, Sophie Scharlin-Pettee, Suman Seth, Ana Vaz, Frank Vollmer and Claire Walkey.
2 GLOBAL Multidimensional POVERTY INDEX 2019 ILLUMINATING InequalitiesEmpowered lives. Resilient nations. OPHIO xford POVERTY & Human Development InitiativeContentsWhat is the GLOBAL Multidimensional POVERTY INDEX ? 1 What can the GLOBAL Multidimensional POVERTY INDEX tell us about inequality? 2 Inequality between and within countries 4 Children bear the greatest burden 6 Inside the home: a spotlight on children in South Asia 7 Leaving no one behind 9 Case study: Ethiopia 11 Inequality among multidimensionally poor people 13 Multidimensional POVERTY and economic inequality 13 The bottom 40 percent: growing together? 15 Notes 17 References 17 How the GLOBAL Multidimensional POVERTY INDEX is calculated 18 STATISTICAL TABLES1 Multidimensional POVERTY INDEX : developing countries 202 Multidimensional POVERTY INDEX : changes over time 22 FIGURES1 Structure of the GLOBAL Multidimensional POVERTY INDEX 22 Both low- and middle-income countries have a wide range of multidimensional POVERTY 33 Going beyond averages shows great subnational disparities in Uganda 54 A higher proportion of children than of adults are multidimensionally poor, and the youngest children bear the greatest burden 65 Child-level data in the GLOBAL Multidimensional POVERTY INDEX 76 In South Asia the percentage of school-age children who are multidimensionally poor and out of school varies by country 87 Ethiopia, India and Peru significantly reduced deprivations in all 10 indicators.
3 Each in different ways 98 Trends in POVERTY reduction in subnational regions for selected countries 109 Ethiopia has made substantial improvements in all Multidimensional POVERTY INDEX indicators 1110 Deprivations among multidimensionally poor people in Ethiopia are particularly high for standard of living indicators 1211 Inequality among multidimensionally poor people tends to increase with Multidimensional POVERTY INDEX value, but there is wide variation across countries 1312 There is no correlation between economic inequality and Multidimensional POVERTY INDEX value 1413 The incidence of multidimensional POVERTY is strongly but imperfectly correlated with inequality in education. 1514 Of eight selected countries with data, only Peru and Viet Nam saw higher growth in income or consumption per capita among the poorest 40 percent than among the total population 1515 In all but one of the 10 selected countries the bottom 40 percent are improving Multidimensional POVERTY INDEX attainments faster than the total population 16ii | GLOBAL MULTIDIMENSIONAL POVERTY INDEX 2019 The GLOBAL Multidimensional POVERTY INDEX (MPI) compares acute multidimensional POVERTY for more than 100 countries and billion people and monitors changes over timeGlobal Multidimensional POVERTY INDEX 2019 ILLUMINATING inequalitiesWhat is the GLOBAL Multidimensional POVERTY INDEX ?
4 Sustainable Development Goal (SDG) 1 aims to end POVERTY in all its forms and Although often defined according to income, POVERTY can also be defined in terms of the deprivations people face in their daily lives. The GLOBAL Multidimensional POVERTY INDEX (MPI) is one tool for measuring progress against SDG 1. It compares acute multidimen-sional POVERTY for more than 100 countries and billion people and monitors changes over GLOBAL MPI scrutinizes a person s depri-vations across 10 indicators in health, educa-tion and standard of living (figure 1) and offers a high-resolution lens to identify both who is poor and how they are poor. It complements the international $ a day POVERTY rate by showing the nature and extent of overlapping deprivations for each person. The 2019 update of the GLOBAL MPI covers 101 countries 31 low income, 68 middle income and 2 high income and uses data from 50 Demographic and Health Surveys (DHS), 42 Multiple Indicator Cluster Surveys (MICS), one DHS-MICS and eight national surveys that provide comparable information to DHS and Data are from 2007 2018, though billion of the billion people covered and bil-lion of the billion multidimensionally poor people identified are captured by surveys from 2013 or GLOBAL MPI is disaggregated by age group and geographic area to show POVERTY patterns within countries.
5 It is also broken down by indicator to highlight which dep-rivations characterize POVERTY and drive its reduction or increase. These analyses are vital for GLOBAL MPI was developed in 2010 by the Oxford POVERTY and Human Development Initiative (OPHI) at the University of Oxford and the Human Development Report Office of the United Nations Development Programme (UNDP) for the flagship Human Development Report. The figures and analysis are updated at least once a year using newly re-leased data. See the back cover for more details on the GLOBAL findings Across 101 countries, billion peo-ple percent are multidimensionally Two-thirds of multidimensionally poor peo-ple live in middle-income countries (p. 3). There is massive variation in multidimen-sional POVERTY within countries. For exam-ple, Uganda s national multidimensional POVERTY rate ( percent) is similar to the Sub-Saharan Africa average ( percent), but the incidence of multidimensional POVERTY in Uganda s provinces ranges from percent to percent, a range similar to that of national multidimen-sional POVERTY rates in Sub-Saharan Africa ( percent).
6 Half of the billion multidimensionally poor people are children under age 18. A third are children under age 10 (p. 6). This year s spotlight on child POVERTY in South Asia reveals considerable diversity. While percent of South Asian girls are out of school and live in a multidimension-ally poor household, that average hides vari-ation: in Afghanistan percent do (p. 7). In South Asia percent of children under age 5 experience intrahousehold inequality in deprivation in nutrition (where at least one child in the household is malnourished and at least one child in the household is not). In Pakistan over a third of children under age 5 experience such intrahousehold inequality (p. 8). Of 10 selected countries for which chang-es over time were analysed, India and Cambodia reduced their MPI values the fastest and they did not leave the poorest groups behind (p.)
7 9). ILLUMINATING INEQUALITIES | 1 There is wide variation across countries in inequality among multidimensionally poor people that is, in the intensity of POVERTY experienced by each poor person There is wide variation across countries in inequality among multidimensionally poor people that is, in the intensity of POVERTY experienced by each poor person. For exam-ple, Eg ypt and Paraguay have similar MPI values, but inequality among multidimen-sionally poor people is considerably higher in Paraguay (p. 13). There is little or no association between eco-nomic inequality (measured using the Gini coefficient) and the MPI value (p. 13). In the 10 selected countries for which chang-es over time were analysed, deprivations declined faster among the poorest 40 percent of the population than among the total pop-ulation (p. 15).What can the GLOBAL Multidimensional POVERTY INDEX tell us about inequality?
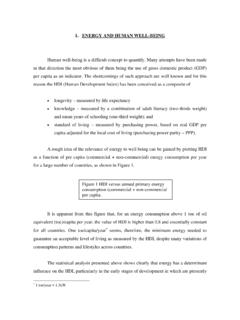
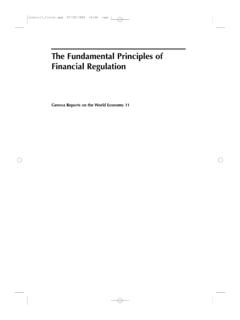
8 The world is increasingly troubled by inequali-ty. Citizens and politicians alike recognize the growing inequality in many societies and its po-tential influence on political stability, econom-ic growth, social cohesion and even happiness. But how is inequality linked to POVERTY ? POVERTY identifies people whose attainments place them at the bottom of the distribution. Inequality considers the shape of the distri-bution: how far those at the bottom are from the highest treetops and what lies in between. Though inequality is complex, if the bottom of the distribution rises if the poorest improve the fastest one troubling aspect of inequality is addressed. FIGURE 1 Structure of the GLOBAL Multidimensional POVERTY IndexHealthEducationStandardof livingNutritionChild mortalityThr ee dimensions of pover tyYears of schoolingSchool attendanceCooking fuelSanitationDrinking waterElectricityHousingAssetsSource: Oxford POVERTY and Human Development Initiative | GLOBAL MULTIDIMENSIONAL POVERTY INDEX 2019 Showcasing INEQUALITIES multidimensionally The SDGs call for disaggregated information in order to identify who is catching up and who is being left behind.
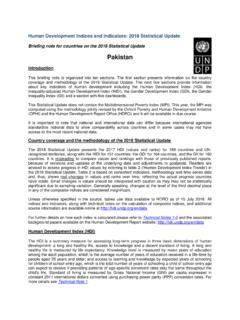
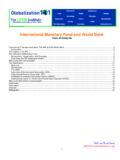
9 To meet this need, the MPI has been disaggregated by 1,119 subnational regions as well as by age and rural-urban area. This report uses that information to highlight gender and intrahousehold INEQUALITIES in South Asia and track whether countries that reduce multidimensional POVERTY are leaving no one averagesLow- and middle-income countries have extensive subnational inequality (figure 2).4 Of the billion multidimensionally poor people worldwide, 886 million more than two-thirds of them live in middle-income countries: FIGURE 2 Both low- and middle-income countries have a wide range of multidimensional poverty30405060700 Intensity (percent)102030405060708090100 Upper-middle-income countries (94 million multidimensionally poor people)30405060700 Intensity (percent)102030405060708090100 Lower-middle-income countries (792 million multidimensionally poor people)30405060700 Intensity (percent)102030405060708090100 Incidence (percent)Low-income countries (440 million multidimensionally poor people)Note: Each bubble represents a subnational region; the size of the bubble reflects the number of multidimensionally poor people.
10 The figure is based on 1,119 subnational regions in 83 countries plus national averages for 18 countries. Data are from surveys conducted between 2007 and 2018. Source: Alkire, Kanagaratnam and Suppa (2019) based on Human Development Report Office and Oxford POVERTY and Human Development Initiative calculations. ILLUMINATING INEQUALITIES | 3 Across the 101 countries covered by the GLOBAL MPI, percent of people are multidimensionally poor, but the incidence of multidimensional POVERTY varies across developing regions from percent in Europe and Central Asia to percent in Sub-Saharan Africa 94 million multidimensionally poor people live in upper-middle-income countries, where the subnational incidence of multidi-mensional POVERTY ranges from 0 percent to percent. 792 million multidimensionally poor live in lower-middle-income countries, where the subnational incidence of multi-dimensional POVERTY ranges from 0 percent to percent.