Transcription of Global Waste Management Practices - World Bank
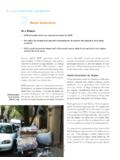
1 4 URBAN DEVELOPMENT SERIES KNOWLEDGE PAPERSG lobal Waste Management PracticesAt a glance : `In solid Waste Management there is no throwing away . `The organic fraction of Waste , collection vehicles, and Waste disposal methods contribute to GHG emissions. `The last two decades have brought a new challenge for Waste Management : the growing vagaries of Global secondary materials solid Waste Management there is no away . When throwing away Waste , system complex-ities and the integrated nature of materials and pollution are quickly apparent. For example, Waste incineration is expensive and poses challenges of air pollution and ash disposal. Incineration requires Waste placed outside for collection to be containerized to stay dry, and much of the Waste stream is not combustible.
2 Landfills require land availability, and siting is often opposed by potential neighboring residents. Solving one problem often introduces a new one, and if not well executed, the new problem is often of greater cost and complexity. BOX 2 Definitions of Municipal Solid WasteBy OECD: Municipal Waste is collected and treated by, or for municipalities. It covers Waste from households, including bulky Waste , similar Waste from commerce and trade, office buildings, insti-tutions and small businesses, yard and garden, street sweepings, contents of litter containers, and market cleansing. Waste from municipal sewage networks and treatment, as well as municipal construction and demolition is PAHO: Solid or semi-solid Waste generated in population centers including domestic and, commercial wastes, as well as those originated by the small-scale industries and institutions (including hospital and clinics); market street sweeping, and from public IPCC: The IPCC includes the following in MSW: food Waste ; garden (yard) and park Waste ; paper and cardboard; wood; textiles; nappies (disposable diapers); rubber and leather; plastics; metal; glass (and pottery and china); and other ( , ash, dirt, dust, soil, electronic Waste ).
3 ITC landfill and recycling center, Ankara, Turkey Photo: Simone D. McCourtie/ World BankWHAT A Waste : A Global REVIEW OF SOLID Waste MANAGEMENT5 ActivityLow IncomeMiddle IncomeHigh IncomeSource ReductionNo organized programs, but reuse and low per capita Waste generation rates are discussion of source reduction, but rarely incorporated into an organized education programs emphasize the three R s reduce, reuse, and recycle. More producer responsibility & focus on product and inefficient. Service is limited to high visibility areas, the wealthy, and businesses willing to pay. High fraction of inerts and compostables impact collection overall collection below 50%.Improved service and increased collection from residential areas.
4 Larger vehicle fleet and more mechanization. Collection rate varies between 50 to 80%. Transfer stations are slowly incorporated into the SWM rate greater than 90%. Compactor trucks and highly mechanized vehicles and transfer stations are common. Waste volume a key consideration. Aging collection workers often a consideration in system most recycling is through the informal sector and Waste picking, recycling rates tend to be high both for local markets and for international markets and imports of materials for recycling, including hazardous goods such as e- Waste and ship-breaking. Recycling markets are unregulated and include a number of middlemen . Large price sector still involved; some high technology sorting and processing facilities.
5 Recycling rates are still relatively high. Materials are often imported for recycling. Recycling markets are somewhat more regulated. Material prices fluctuate material collection services and high technology sorting and processing facilities are common and regulated. Increasing attention towards long-term markets. Overall recycling rates higher than low and middle income. Informal recycling still exists ( aluminum can collection.) Extended product responsibility undertaken formally even though the Waste stream has a high percentage of organic material. Markets for, and awareness of, compost lacking. Large composting plants are often unsuccessful due to contamination and operating costs (little Waste separation); some small-scale composting projects at the community/ neighborhood level are more sustainable.
6 Composting eligible for CDM projects but is not widespread. Increasing use of anaerobic digestion. Becoming more popular at both backyard and large-scale facilities. Waste stream has a smaller portion of compostables than low- and middle-income countries. More source segregation makes composting easier. Anaerobic digestion increasing in popularity. Odor control common, and generally not successful because of high capital, technical, and operation costs, high moisture content in the Waste , and high percentage of incinerators are used, but experiencing financial and operational difficulties. Air pollution control equipment is not advanced and often by-passed. Little or no stack emissions monitoring.
7 Governments include incineration as a possible Waste disposal option but costs prohibitive. Facilities often driven by subsidies from OECD countries on behalf of equipment in areas with high land costs and low availability of land ( , islands). Most incinerators have some form of environmental controls and some type of energy recovery system. Governments regulate and monitor emissions. About three (or more) times the cost of landfilling per tonne. Landfilling/DumpingLow-technology sites usually open dumping of wastes. High polluting to nearby aquifers, water bodies, settlements. Often receive medical Waste . Waste regularly burned. Significant health impacts on local residents and workers. Some controlled and sanitary landfills with some environmental controls.
8 Open dumping is still common. CDM projects for landfill gas are more common. Sanitary landfills with a combination of liners, leak detection, leachate collection systems, and gas collection and treatment systems. Often problematic to open new landfills due to concerns of neighboring residents. Post closure use of sites increasingly important, golf courses and (see Annex E)Collection costs represent 80 to 90% of the municipal solid Waste Management budget. Waste fees are regulated by some local governments, but the fee collection system is inefficient. Only a small proportion of budget is allocated toward disposal. Collection costs represent 50% to 80% of the municipal solid Waste Management budget.
9 Waste fees are regulated by some local and national governments, more innovation in fee collection, included in electricity or water bills. Expenditures on more mechanized collection fleets and disposal are higher than in low-income costs can represent less than 10% of the budget. Large budget allocations to intermediate Waste treatment facilities. Up front community participation reduces costs and increases options available to Waste planners ( , recycling and composting). TABLE 1 Comparison of Solid Waste Management Practices by Income Level (adapted from What a Waste 1999)6 URBAN DEVELOPMENT SERIES KNOWLEDGE PAPERSL ocally, Waste collection vehicles are large sources of emissions and both incineration and landfilling contribute GHG emissions.
10 Uncol-lected Waste can provide breeding areas and food to potentially disease carrying vectors such as insects and rodents, with their associated health and nuisance issues. Waste Management cannot be effectively managed without due consider-ation for issues such as the city s overall GHG emissions, labor market, land use planning, and myriad related progress in solid Waste Management Practices in the decade since the original What a Waste Report was published, fundamental insti-tutional, financial, social, and environmental problems still exist. Although each country and city has their own site-specific situations, general observations can be made across low-, middle-, and high-income countries, as delineated in Table 1.