Transcription of Good Lab Report Example - University of Alabama
1 ME Lab Report 0 ME 360 Lab 0: Electrical Filters Joe Schmoe Lab partners: Sally Smith and John Doe February 30, 2002 ME Lab Report 0 Objective The objective of this lab is to build and test a first order, low-pass filter with resistors and capacitors. The magnitude response of the filter to sinusoidal inputs of various frequencies will be measured and compared to values predicted from electrical circuit theory. Background Signal conditioning is the process of improving an electrical signal for measurement or other usage. Many electrical and electronic devices are subject to noise, which is defined as any unwanted signal (Ample Technology, 2001). A typical source of electrical noise comes from the 60 Hz AC voltages used in fluorescent lights. In common mechanical engineering usage, a filter removes unwanted materials; for Example , oil filters remove metal particles from engines. An electrical filter is used to remove, or at least reduce, the amplitude of unwanted electrical signals.
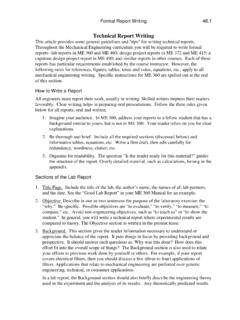
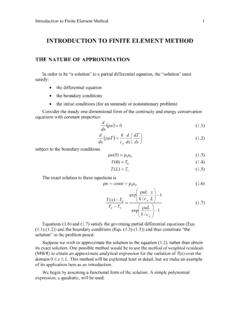
2 In this context filters can be used to remove signals in desired frequency ranges. Filters eliminate noise by allowing only certain frequencies to pass (Wheeler & Ganji, 1996). Filters may be passive (no external power required, all power comes from the signal itself) or active (external power provided, signal can be both filtered and amplified). The simplest type of filter is the low pass filter. An ideal low pass filter allows low frequencies to pass while blocking high frequency signals. Figure 1 shows simple low pass filter along with the ideal and actual filter magnitude responses. The low pass filter is constructed from only two passive components: a resistor and a capacitor. All of the power for the circuit is supplied by the input signal. Thus the filter shown in Figure 1 is a low pass, passive filter. An active filter would have an externally powered op-amp in the circuit for amplification (Wobschall, 1979). ME Lab Report 0 0 1 Ideal ResponseECRC ircuitE0EE1 Actual ResponsebbiooiEEoi Figure 1.
3 Ideal and actual low pass filter response. The value of the input and output voltages can be found from the circuit with the concept of complex impedance (Z). With the assumption that the measurement device for determining Eo draws no current, then a single current flows in the low pass filter circuit. The output voltage Eo is the current (I) times the impedance seen by the output: EIZI1jCoo (1) The input voltage Ein must be the current times the total impedance seen from the input, which is the resistor and capacitor impedances in series, Cj1 RIIZEii (2) where E and I are voltage in volts and current in amps, respectively, R and C are the resistance in ohms and capacitance in farads, respectively, j is the imaginary number, and is the frequency of the input signal in radians/second.
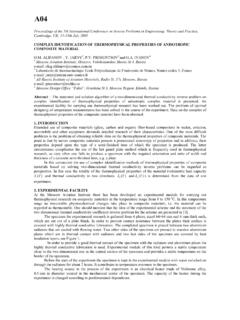
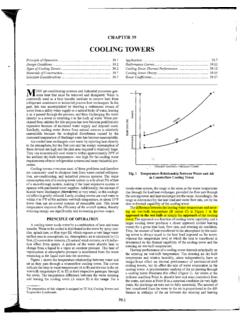
4 The filter gain is the magnitude of the ratio of output voltage to the input voltage, ME Lab Report 0 2RC)(111+Cj1Cj1 RCj1 IZIZEE ioio Rgain (3) The break frequency of a low-pass filter is b, where b1RC (units of rad/sec). Experiment A low pass filter was constructed on a breadboard and instrumented as shown in Figure 2. A Goldstar FG-8002 function generator was used to supply sinusoidal signals to the filter. The function generator output was set to 5 volts amplitude (10 volts peak-to-peak). Frequencies in the range of 8 Hz (50 rad/sec) to 32 kHz (200,000 rad/sec) were tested. Table 1 lists the desired and actual frequencies tested during the lab. Both the input and output signals were measured with a National Instruments AT-MIO-16E-10 data acquisition board installed in a 550 MHz Dell computer. The VirtualScope software was used to facilitate the setting of sampling rates and to provide a visual display of the data during testing. Individual screens of data were saved to disk for subsequent plotting in Excel.
5 After the experiment, the resistor and capacitor were removed Table 1 Desired and Actual Frequencies for Low Pass Filter Experiment Desired Frequency Actual Frequency Desired Frequency Actual Frequency (Hz) (Hz) (Hz) (Hz) 10 8 800 800 15 16 1500 1600 30 32 3000 3200 80 80 8000 8000 150 160 15,000 16,000 300 320 30,000 32,000 ME Lab Report 0 from the circuit and measured.
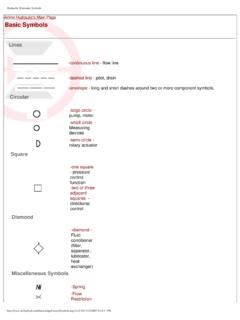
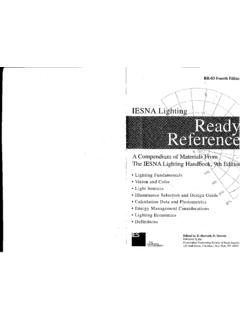
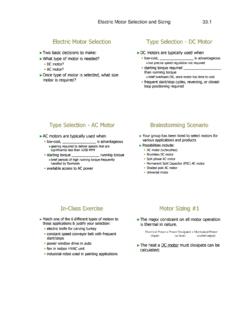
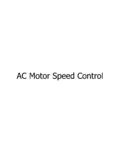
6 A resistance of k was measured with a LG Precision DM-441B digital multimeter. The capacitance of F was measured with a Data Precision 938 capacitance meter. Function GeneratorVirtualScope EiR = k Eo+-C = F Figure 2. Experimental setup for low-pass filter test. Results A plot of typical waveforms produced during the experiment is shown in Figure 3. Note that the input signal is larger than the output signal. , secVoltage, voltsInputOutput Figure 3. Sample plot of input and output voltages. ME Lab Report 0 The magnitude response (ratio of output amplitude, Eo to input amplitude, Ei) of electrical filters is usually plotted in units of decibels (dB), where io10dBEElog20M (4) The theoretical break frequency calculated from the experimentally measured resistance and capacitance (see the Appendix) was 1500 rad/sec or 240 Hz. Figure 4 shows a plot of experimental magnitude response and the theoretical response computed from Eq.
7 4. The experimental and theoretical values match very well at all frequencies except 50 kHz. Several sources of error were accounted for in the uncertainty analysis. Uncertainty in the measurements of resistance, R, and capacitance, C, combined to give an uncertainty of 25 rad/sec ( 4 Hz) in the theoretical break frequency. The calculations for this uncertainty analysis are shown in the Appendix. The uncertainty in the theoretical break frequency is shown -45-40-35-30-25-20-15-10-505101001000100 001000001000000 , rad/secMagnitude, dBTheoreticalExperimental Figure 4. Theoretical and experimental results for low-pass filter. ME Lab Report 0 by the dashed lines above and below the solid line in Figure 4. The accuracy of the data acquisition board used in the measurement of the amplitude of the input and output sine waves contributed to uncertainty in the experimental magnitude response. The individual error bars for the experimental data points in Figure 4 show this uncertainty.
8 The error bar regions of the theoretical and experimental results overlap for all data points except at 50 Hz, which is very close. All measurement error is accounted for by the uncertainty analysis, so there is no need to identify additional sources of error. Conclusions An electrical low-pass filter was tested with input sinusoidal signals of different frequencies. At frequencies below the break frequency the input and output signals had essentially the same amplitude. As the input frequency was increased above the break frequency, the output signal amplitude began to decrease significantly. The theoretical formula that predicts the magnitude response gave results very similar to the experimental ones. This experiment was successful in demonstrating the validity of the theoretical formula for a first-order, low-pass filter constructed from a single resistor and capacitor. Therefore, the objectives of the lab were met. References Ample Technology ( ). Electrical noise sources.
9 Retrieved July 30, 2001, from Wheeler, , & Ganji, (1996). Introduction to engineering experimentation. Upper Saddle River, NJ: Prentice-Hall. Wobschall, D. (1979). Circuit design for electronic instrumentation. New York, NY: McGraw-Hill. ME Lab Report 0 Appendix Contents 1. Assumptions for uncertainty values page 8 2. Sample calculation for theoretical break frequency page 8 3. Sample calculation for uncertainty in the theoretical break frequency page 9 4. Sample calculation for experimental gain page 9 5. Sample calculation for uncertainty in experimental gain page 9 6. Raw data page 10 Assumptions for uncertainty values Measurements made with National Instruments VirtualScope: o Frequency uncertainties are 1% (of reading) + 1 digit Measurements made with LG Precision DM-441B digital multimeter: o Resistance uncertainties are (of reading) + 2 digits Measurements made with Data Precision 938 capacitance meter: o Capacitance uncertainties are (of reading) + 1 digit Sample calculation for theoretical break frequency ME Lab Report 0 Sample calculation for uncertainty in the theoretical break frequency Sample calculation for experimental gain Sample calculation for uncertainty in experimental gain