Transcription of Government of India Ministry of Commerce & …
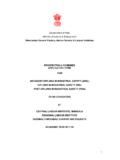
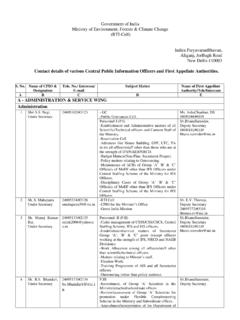
1 Page 1 of 4 Government of India Ministry of Commerce & industry Department of Industrial Policy & Promotion Office of the Economic Adviser Index of Eight Core Industries (Base: 2011-12=100) April, 2018 1. The summary of the Index of Eight Core Industries (base: 2011-12) is given at the Annexure. 2. The Eight Core Industries comprise per cent of the weight of items included in the Index of Industrial Production (IIP). The combined Index of Eight Core Industries stands at in April, 2018, which was per cent higher as compared to the index of April, 2017. Its cumulative growth during April to March, 2017-18 was per cent. Coal 3. Coal production (weight: per cent) increased by per cent in April, 2018 over April, 2017. Its cumulative index increased by per cent during April to March, 2017-18 over corresponding period of the previous year. Crude Oil 4. Crude Oil production (weight: per cent) declined by per cent in April, 2018 over April, 2017.
2 Its cumulative index declined by per cent during April to March, 2017-18 over the corresponding period of previous year. Natural Gas 5. The Natural Gas production (weight: per cent) increased by per cent in April, 2018 over April, 2017. Its cumulative index increased by per cent during April to March, 2017-18 over the corresponding period of previous year. Page 2 of 4 Refinery Products 6. Petroleum Refinery production (weight: per cent) increased by per cent in April, 2018 over April, 2017. Its cumulative index increased by per cent during April to March, 2017-18 over the corresponding period of previous year. Fertilizers 7. Fertilizers production (weight: per cent) increased by per cent in April, 2018 over April, 2017. Its cumulative index increased by per cent during April to March, 2017-18 over the corresponding period of previous year. Steel 8. Steel production (weight: per cent) increased by per cent in April, 2018 over April, 2017.
3 Its cumulative index increased by per cent during April to March, 2017-18 over the corresponding period of previous year. Cement 9. Cement production (weight: per cent) increased by per cent in April, 2018 over April, 2017. Its cumulative index increased by per cent during April to March, 2017-18 over the corresponding period of previous year. Electricity 10. Electricity generation (weight: per cent) increased by per cent in April, 2018 over April, 2017. Its cumulative index increased by per cent during April to March, 2017-18 over the corresponding period of previous year. Note 1: Data for February, 2018, March, 2018 and April, 2018 are provisional. Note 2: Since April, 2014, Electricity generation data from Renewable sources are also included. Note 3: The industry -wise weights indicated above are individual industry weight derived from IIP and blown up on pro rata basis to a combined weight of ICI equal to 100.
4 Note 4: Release of the index for May, 2018 will be on Monday, 2nd July, 2018. Page 3 of 4 Annexure Performance of Eight Core Industries Yearly Index & Growth Rate Base Year: 2011-12=100 Index Sector Weight 2012-13 2013-14 2014-15 2015-16 2016-17 2017-18 Coal Crude Oil Natural Gas Refinery Products Fertilizers Steel Cement Electricity Overall Index Growth Rates (in per cent) Sector Weight 2012-13 2013-14 2014-15 2015-16 2016-17 2017-18 Coal Crude Oil Natural Gas Refinery Products Fertilizers Steel Cement Electricity Overall Index Page 4 of 4 Performance of Eight Core Industries Monthly Index & Growth Rate Base Year: 2011-12=100 Index Sector Coal Crude Oil Natural Gas Refinery Products Fertilizers Steel Cement Electricity Overall Index Weight Apr-17 May-17 Jun-17 Jul-17 Aug-17 Sep-17 Oct-17 Nov-17 Dec-17 Jan-18 Feb-18 Mar-18 Apr-18 Growth Rates (in per cent) Sector Coal Crude Oil Natural Gas Refinery Products Fertilizers Steel Cement Electricity Overall Index Weight Apr-17 May-17 Jun-17 Jul-17 Aug-17 Sep-17 Oct-17 Nov-17 Dec-17 Jan-18 Feb-18 Mar-18 Apr-18 **