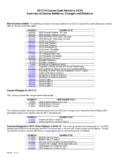
Transcription of Grade 3 Mathematics Standards Coverage
1 Test Design Summary and Blueprint: Mathematics Grade 3 Mathematics Standards Coverage Reporting Category Standard % of Test Operations, Algebraic Thinking, and Numbers in 48. Base Ten Also Assesses Numbers and Operations - Fractions 17. Measurement, Data, and Geometry 35. Also Assesses and Total Standard Groupings 22 100. Critical areas of focus were included in the determination of the percentage for each reporting category. 1|Page November 2017. Test Design Summary and Blueprint: Mathematics Grade 4 Mathematics Standards Coverage Reporting Category Standard % of Test Operations and Algebraic Thinking 21. Also Assesses Numbers and Operations in Base Ten 21.
2 Numbers and Operations Fractions 25. Measurement, Data, and Geometry 33. Also Assesses Total Standard Groupings 28 100. Critical areas of focus were included in the determination of the percentage for each reporting category. 2|Page November 2017. Test Design Summary and Blueprint: Mathematics Grade 5 Mathematics Standards Coverage Reporting Category Standard % of Test Operations, Algebraic Thinking, and Fractions 39. Also Assesses Numbers and Operations in Base Ten 28. Also Assesses Measurement, Data, and Geometry 33. Also Assesses Also Assesses Total Standard Groupings 22 100. Critical areas of focus were included in the determination of the percentage for each reporting category.
3 3|Page November 2017. Test Design Summary and Blueprint: Mathematics Grade 6 Mathematics Standards Coverage Reporting Category Standard % of Test Ratio and Proportional Relationships 15%. Expressions and Equations 30%. Geometry 15%. Statistics & Probability 19%. The Number System 21%. Also Assesses Total Standard Groupings 28 100%. Critical areas of focus were included in the determination of the percentage for each reporting category. 4|Page November 2017. Test Design Summary and Blueprint: Mathematics Grade 7 Mathematics Standards Coverage Reporting Category Standard % of Test Ratio and Proportional Relationships 25%.
4 Expressions and Equations 21%. Geometry 23%. Also Assesses Also Assesses Statistics and Probability 16%. Also Assesses The Number System 15%. Total Standard Groupings 21 100%. Critical areas of focus were included in the determination of the percentage for each reporting category. 5|Page November 2017. Test Design Summary and Blueprint: Mathematics Grade 8 Mathematics Standards Coverage Reporting Category Standard % of Test Expressions and Equations 30%. Functions 25%. Also Assesses Also Assesses Geometry 27%. Also Assesses Statistics and Probability and 18%. The Number System Total Standard Groupings 26 100%. Critical areas of focus were included in the determination of the percentage for each reporting category.
5 6|Page November 2017. Test Design Summary and Blueprint: Mathematics Algebra 1 EOC Standards Coverage Reporting Category Standard % of Test Also Assesses and Also Assesses , , and Algebra and Modeling 41%. Also Assesses Also Assesses and Also Assesses and Also Assesses Also Assesses Functions and Modeling 40%. Also Assesses and Also Assesses Also Assesses and Also Assesses and Statistics and the Number 19%. System Also Assesses Also Assesses and Total Standard Groupings 21 100%. Number and Quantity: , and are assessed throughout. Critical areas of focus were included in the determination of the percentage for each reporting category.
6 7|Page November 2017. Test Design Summary and Blueprint: Mathematics Geometry EOC Standards Coverage Reporting Category Standard % of Test Also Assesses Also Assesses Also Assesses and Congruence, Similarity, Right 46%. Triangles, and Trigonometry Also Assesses Also Assesses Also Assesses and Circles, Geometric 38%. Measurement, and Geometric Properties with Equations Modeling with Geometry 16%. Total Standard Groupings 28 100%. Critical areas of focus were included in the determination of the percentage for each reporting category. 8|Page November 2017. Test Design Summary and Blueprint: Mathematics Percentage of Points by Depth of Knowledge Level Grade /Course DOK Level 1 DOK Level 2 DOK Level 3.
7 3 8 10% 20% 60% 80% 10% 20%. Algebra 1 10% 20% 60% 80% 10% 20%. Geometry 10% 20% 60% 80% 10% 20%. CPALMS coordinated the development of common definitions using Dr. Norman Webb's model for Depth of Knowledge. These definitions serve as the cornerstone for the rating of the Mathematics and English Language Arts Standards available on CPALMS. Because the DOK model of content complexity was designed primarily as a framework for aligning content Standards and assessments, it is important to distinguish between the DOK rating for a given standard and the possible DOK ratings for assessment items designed to address the standard.
8 The DOK. level for an individual content standard is intended to represent the typical performance level of cognitive complexity that a learning activity or assessment item associated with that standard might entail. This is particularly important for assessment purposes, since 50% or more of assessment items associated with a given standard should meet or exceed the DOK level of the standard. For information about content complexity rating, please visit CPALMS at For information about the content complexity rating for each standard, please visit CPALMS and click the applicable content area by Grade at #0. A drop-down menu for each strand and cluster includes the content complexity rating for each standard.
9 9|Page November 2017. Test Design Summary and Blueprint: Mathematics Test Length This table provides the approximate range for the number of items on each test. Grade /Course Number of Items 3 60 64. 4 60 64. 5 60 64. 6 62 66. 7 62 66. 8 62 66. Algebra 1 64 68. Geometry 64 68. Note: Approximately 6 10 items on all of the tests listed above are experimental (field test) items and are included in the ranges above but are not included in students' scores. Sessions and Times Grade /Course Administration Time Number of Sessions* Computer-Based 3 160 minutes 2 Yes 4 160 minutes 2 Yes 5 160 minutes 2 Yes 6 180 minutes 3 Yes 7 180 minutes 3** Yes 8 180 minutes 3** Yes Algebra 1 180 minutes 2** Yes Geometry 180 minutes 2** Yes *All sessions are administered over two days.
10 **Session 1 is the non-calculator portion of each assessment. Percentage of Computer-Based Test Composed of Technology-Enhanced Items Grade /Course Percentage Range Grades 3-8 Mathematics 25% 50%. Algebra 1 and Geometry EOCs 40% 60%. 10 | P a g e November 2017. Test Design Summary and Blueprint: Mathematics Florida Standards Assessments Technology-Enhanced Item Descriptions The Florida Standards Assessments (FSA) are composed of test items that include traditional multiple- choice items, items that require students to type or write a response, and technology-enhanced items (TEI). Technology-enhanced items are computer-delivered items that require students to interact with test content to select, construct, and/or support their answers.