Transcription of GRADING FLORIDA PUBLIC SCHOOLS
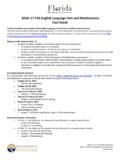
1 Page | 1 GRADING FLORIDA PUBLIC SCHOOLS 2018-19 School grades provide an easily understandable metric to measure the performance of a school. Parents and the general PUBLIC can use the school grade and its associated components to understand how well each school is serving its students. The school grades calculation was revised substantially for the 2014-15 school year to implement statutory changes made by the 2014 Legislature and incorporate the new FLORIDA standards Assessments (FSA). The 2018-19 school grades model uses the school grades model adopted for 2014-15.
2 The school GRADING system focuses the school GRADING formula on student success measures: Achievement Learning gains Graduation Acceleration success Maintaining a focus on students who need the most support The 2018-19 School Grades Model English Language Arts (FSA, FSAA) Mathematics (FSA, FSAA, EOCs) Science (NGSSS, FSAA, EOCs) Social Studies (EOCs) Graduation Rate Acceleration Success Achievement (0% to 100%) Achievement (0% to 100%) Achievement (0% to 100%) Achievement (0% to 100%) 4-year Graduation Rate (0% to 100%) High School (AP, IB, AICE, Dual Enrollment or Industry Certification)
3 (0% to 100%) Learning Gains (0% to 100%) Learning Gains (0% to 100%) Bl ank Bl ank Bl ank Learning Gains of the Lowest 25% (0% to 100%) Learning Gains of the Lowest 25% (0% to 100%) Bl ank Bl ank Bl ank Middle School (EOCs or Industry Certifications) (0% to 100%) Components In 2018-19, a school s grade may include up to 11 components. There are four achievement components, as well as components for learning gains, learning gains of the lowest 25% of students, middle school acceleration, graduation rate and college and career acceleration.
4 Each component is worth up to 100 points in the overall calculation. Four Achievement Components The four achievement components are English Language Arts, Mathematics, Science and Social Studies. These components include student performance on statewide standardized assessments, including the comprehensive assessments and end-of-course (EOC) assessments. The components measure the percentage of full-year enrolled students who achieved a passing score. Four Learning Gains Components These components are learning gains in English Language Arts and Mathematics, as well as learning gains for the lowest performing 25% of students in English Language Arts and Mathematics.
5 These components include student performance on statewide standardized assessments, including the comprehensive Page | 2 assessments and EOC assessments for the current year and the prior year. The components measure the percentage of full-year-enrolled students who achieved a learning gain from the prior year to the current year. Middle School Acceleration This component is based on the percentage of eligible middle school students who passed a high school level EOC assessment or industry certification. Graduation Rate The graduation rate is based on a four-year adjusted cohort of ninth grade students, and the rate measures whether the students graduate within four years.
6 College and Career Acceleration This component is based on the percentage of graduates from the graduation rate cohort who earned a score on an acceleration examination (AP, IB, or AICE), a grade in a dual enrollment course that qualified for college credit or earned an industry certification. School Grades Calculation The points earned for each component are added together and divided by the total number of possible points to determine the percentage of points earned. School GRADING Percentages A = 62% of points or greater B = 54% to 61% of points C = 41% to 53% of points D = 32% to 40% of points F = 31% of points or less Percent Tested SCHOOLS must test 95 percent of their students.
7 Resources The FLORIDA statute that provides the framework for the school grades calculation is at the following link: Section , The rule adopted by the State Board of Education at its January 17, 2018, meeting describes more specifically the school grades calculation and can be found at the following link: Rule , Additional information describing the calculation and historical information are available at Page | 3 School Grade Distribution 2018 and 2019 School Grades1 All Schools2 Grade 2018 2019 Change Number Percent Number Percent Number Percentage Point A 1,044 31% 1,181 35% 137 4% B 862 26% 909 27% 47 1% C 1,183 36% 1,065 32% -118-4%D 195 6% 159 5% -36-1%F 35 1% 14 0% -21-1%Total 3,319 Blank 3.
8 328 Blank Blank Blank Elementary SCHOOLS Grade 2018 2019 Change Number Percent Number Percent Number Percentage Point A 511 28% 592 33% 81 5% B 435 24% 492 27% 57 3% C 704 39% 609 34% -95-5%D 149 8% 114 6% -35-2%F 25 1% 9 0% -16-1% Total 1,824 Blank 1,816 Blank Blank Blank Middle SCHOOLS Grade 2018 2019 Change Number Percent Number Percent Number Percentage Point A 184 32% 196 34% 12 2% B 156 27% 147 26% -9-1%C 203 36% 203 35% 0 -1%D 27 5% 26 5% -10% F 0 0% 0 0% 0 0% Total 570 Blank572 BlankBlankBlankHigh SCHOOLS Grade 2018 2019 Change Number Percent Number Percent Number Percentage Point A 148 31% 167 35% 19 4% B 154 32% 151 32% -30% C 164 35% 148 31% -16-4%D 7 1% 6 1% -10% F 1 0% 2 0% 1 0% Total 474 Blank474 BlankBlankBlank1 All 2018-19 data reflect post-appeals
9 School grades and school improvement ratings. 2 Percentages may not add to 100 due to rounding. Page | 4 Combination Schools3 Grade 2018 2019 Change Number Percent Number Percent Number Percentage Point A 201 45% 226 48% 25 3% B 117 26% 119 26% 2 0% C 112 25% 105 23% -7-2%D 12 3% 13 3% 1 0% F 9 2% 3 1% -6-1%Total 451 Blank 466 Blank Blank Blank Average Percent of Points Earned 2018 and 2019 School Grades Percent of Points Earned by Letter Grade Grade Average Percent of Points Earned Change 2018 2019 A 70% of possible points earned 70% of possible points earned 0% B 57% of possible points earned 57% of possible
10 Points earned 0% C 48% of possible points earned 48% of possible points earned 0% D 37% of possible points earned 37% of possible points earned 0% F 25% of possible points earned 22% of possible points earned -3%All Graded SCHOOLS 56% of possible points earned 58% of possible points earned 2% The table above compares the average percent of points earned by grade letter of SCHOOLS that earned a grade in 2018 to SCHOOLS that earned a grade in 2019. The average percent of possible points for all SCHOOLS receiving a grade in 2019 increased by two percent (58%) compared to the average percent of possible points for all SCHOOLS that received a grade in 2018 (56%).