Transcription of Graphing Exponential Functions
1 Graphing Exponential Functions What is an Exponential Function? Exponential Functions are one of the most important Functions in mathematics. Exponential Functions have many scientific applications, such as population growth and radioactive decay. Exponential function are also used in finance, so if you have a credit card, bank account, car loan, or home loan it is important to understand Exponential Functions and how they work. Exponential Functions are function where the variable x is inthe exponent. Some examples of Exponential Functions are f(x) = 2 x , f(x) = 5 x 2 , or f(x) = 9 2x + 1.
2 In each of the three examples the variable x is in the exponent, which makes each ofthe examples Exponential Functions . Graphing Exponential Functions To begin Graphing Exponential Functions we will start with two examples. We will graph the two Exponential Functions by making a table of values and plotting the points. After Graphing the first two examples we will take a look at the similarities and differences between the two graphs. When creating a table of values, I always suggest starting with the numbers x = 2, 1, 0, 1, and 2 because it is important to have different types of numbers, some negative, some positive, and zero.
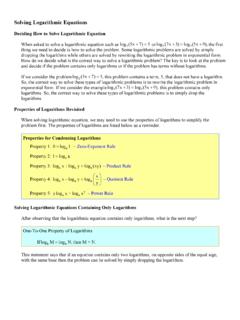
3 Example 1: Graph f(x) = 2 x . x x f(x) 2 = 2 2 2 1 1 f( 2) 2 4 2 - -=== 1 1 1 1 1 f( 1) 2 2 2 - -=== 0 0 f(0) 2 1 == 1 1 f(1) 2 2 == 2 2 f(2) 2 4 == By plotting the five points in the table above and connecting the points, we get the graph shown above. Notice that as the x values get smaller, x = 1, 2, etc. the graph of the function gets closer and closer to the x axis, but never touches the x axis. This means that there is a horizontal asymptote at the x axis or y = 0. A horizontal asymptote is a horizontal line that the graph gets closer and closer to.
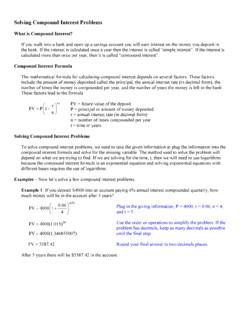
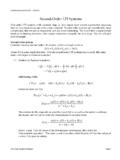
4 AnExponential Function is a function of the form f(x) = b x or y = b x where b is called the base and b is a positive real number other than 1(b > 0 and b 1). The domain of an Exponential function is all real numbers, that is, x can be any real 2: Graph x 1 f(x) 2 = x x 1 f(x) 2 = 2 2 22 22 112 f( 2)4 2 21 - - - -==== 1 1 11 11 112 f( 1)2 2 21 - - - -==== 0 0 1 f(0)1 2 == 1 1 1 1 11 1 f(1) 22 2 === 2 2 2 2 11 1 f(2) 24 2 === By plotting the five points in the table above and connecting the points, we get the graph shown above.
5 Notice that as the x values get larger, x = 1, 2, etc. the graph of the function gets closer and closer to the x axis, but never touches the x axis. This means that there is a horizontal asymptote at the x axis or y = 0. Now we can look at the similarities and differences between the graphs. Similarities The domain for each example is all real numbers. The range for each example is all positive real numbers. Both graphs pass through the point (0, 1) or the y intercept in each graph is 1. Both graphs get closer and closer to the x axis, but do not touch the x axis.
6 So,each graph has a horizontal asymptote at the x axis or y = 0. Differences In Example 1, the graph goes upwards as it goes from left to right making it an increasing function. An Exponential function that goes up from left to right is called Exponential Growth . In Example 2, the graph goes downwards as it goes from left to right making it a decreasing function. An Exponential function that goes down from left to right is called Exponential Decay . Exponential Growth or Exponential Decay If we are given an exponentialfunctionand asked to predict if the resulting graph would be Exponential growth or Exponential decay, how can we correctly answer the question without actually drawing the graph?
7 The key to correctly answering the question is to look at the base of the Exponential function. Consider the following Exponential Functions and try to predict growth or decayby looking at the base of the function: x 4 f(x) 3 = and x 6 f(x) 5 = The function with the base of 4/3 will be Exponential growth and the other function with a base of 6/5 will also be Exponential growth. The key to determining growth or decay depends on if the base, b, is less than one or greater thanone. If the base is greaterthan one, b > 1, we will get growth, an increase as the graph goes from left to right.
8 If the base is less than one, 0 < b < 1, we will get decay, a decrease as the graphgoes from left to two Functions used above, both4/3 and 6/5 are greater than 1 which is why both graphs would result in Exponential growth. Summary Here is a summary of the features of the graph of an Exponential function, f(x) = b x . By using the features listed above we should be able to create a mentalimage of what the graph should look like before actually drawing the graph. Consider the following Exponential Functions and see if you can develop a mental image of the graph.
9 The graph of f(x) should be Exponential growth because b> 1. The graph should pass through the point (0, 1) and there should be a horizontal asymptote at the x axis. The graph of f(x) should be Exponential decay because b < 1. The graph should pass through the point (0, 1) and there should be a horizontalasymptote at the x axis. Features of the Graph of Exponential Functions in the Form f(x) = b x or y = b x The domain of f(x) = b x is all real numbers. The range of f(x) = b x is all positive real numbers, f(x) > 0 or y > 0.
10 The graph of f(x) = b x must pass through the point (0, 1) because any number, except zero, raised to the zero power is 1. The y intercept of the graph f(x) = b x is always 1. The graph of f(x) = b x always has a horizontal asymptote at the x axis (f(x) = 0 or y = 0) because the graph will get closer and closer to the x axis but never touch the x axis. If 0< b < 1 the graph of f(x) = b x will decrease from left to right and is called Exponential decay. If b > 1 the graph of f(x) = b x will increase from left to right and is called Exponential growth.