Transcription of Graphing Lines - Saint Mary's University
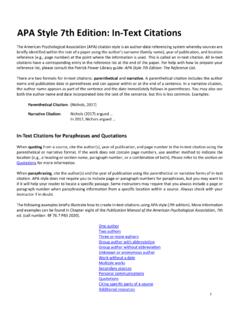
1 45 SNAP Centre Workshop Graphing Lines 46 Graphing a line Using Test Values A simple way to linear equation involves finding test values, plotting the points on a coordinate plane, and connecting the points. Example 1 Given the linear equation = 2 + 3, find the four y-values that correspond to = 0, 1,2,3. Plot the resulting ordered pairs on the coordinate plane, then connect the plotted points to form a graph of solutions to the equation. Start by substituting the x-values into the equation to find the corresponding y-values. = 2 + 3 = 0 = 2(0) + 3 = 3 The resulting ordered pair is (0,3) = 2 + 3 = 1 = 2(1) + 3 = 2 + 3 = 5 The resulting ordered pair is (1,5) = 2 + 3 = 2 = 2(2) + 3 = 4 + 3 = 7 The resulting ordered pair is (2,7) = 2 + 3 = 3 = 2(3) + 3 = 6 + 3 = 9 The resulting ordered pair is (3,9) Next, plot the ordered pairs on the coordinate plane.
2 Conventionally, -values are plotted on the vertical axis since is the dependent variable, and -values are plotted on the horizontal axis since is the independent variable. 47 Finally, draw a line through the four plotted points. (0,3) (1,5) (2,7) (3,9) 48 Example 2 Given the same equation, = 2 + 3, find the two -values that correspond to = 2, 1. Again, plot the resulting ordered pairs on the coordinate plane, then connect the plotted points to form a graph of solutions to the equation. Like the previous example, begin by substituting -values into the equation to find corresponding -values, and then construct ordered pairs.
3 = 2( 2) + 3 = 2 = 1 The resulting ordered pair is ( 2, 1) = 2( 1) + 3 = 1 = 1 The resulting ordered pair is ( 1,1) Plot the new ordered pairs, taking note of the negative - and -values. Once the points are plotted, draw a line through them. The line formed when plotting the second set of test values matches the line formed when plotting the first set. It doesn t matter which particular test values are used to graph a linear equation; as long as the points satisfy the conditions of the given equation, they can be found on the line . Also, notice that only two points were needed to graph the equation. When using test values, two points are needed to graph a line .
4 One point is not enough to define a line , and three or more points (as seen in Example 1) provide no more information regarding the line than two points would. (-2,-1) (-1,1) 49 slope of a line The slope of a line is an indicator of both steepness and direction, and can be used along with other pieces of information to graph a given line . It is defined as the ratio of a line s change in -value to its change in -value between any two points ( 1, 1) and ( 2, 2), and is found using the slope formula 2 1 2 1. Two common ways of expressing this ratio are , with ( delta ) meaning difference in or change in , and more casually ( rise-over-run ), which attempts to physically describe the line s change along the vertical axis relative to its change along the horizontal axis.
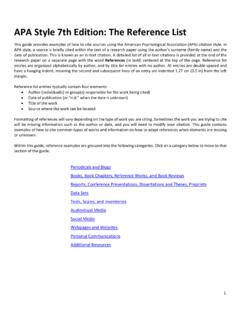
5 Traditionally, slope is represented by a lowercase . Example 3 Determine the slope of each of the Lines pictured below. Since the goal here is to measure the slope of each line , it is necessary to extract enough data to use the formula 2 1 2 1. That means for each line , two x- and y-values must be found. To find these values, plot any two points along each line . (If possible, try to pick points that correspond to whole numbers on the x- and y-axes.) A B C D 50 line A: line A passes through the origin, so a natural choice for one of the points is (0,0). Another point, 1, is picked at random along the line at (5,5). Using the x- and y-values from these two points ( 1 = 5, 2 = 0, 1 = 5, 2 = 0), the line s slope can be calculated: = 2 1 2 1 = 0 50 5 = 5 5 = 1 line A has a slope of +1.
6 In terms of steepness, this indicates that for every unit the line moves along the x-axis, it moves that same number of units along the y-axis. In terms of direction, a positive slope indicates that as the line increases along the x-axis, it also increases along the y-axis. line B: The points where line B crosses the x- and y-axes are suitable for calculating the slope , and are (3,0) and (0,-3), respectively. Again, using the corresponding x- and y-values ( 1 = -3, 2 = 0, 1 = 0, 2 = 3), the line s slope can be calculated: = 2 1 2 1 = 0 ( 3)3 0 = 33 = 1 line B also has a slope of +1. Visually, this makes sense; both Lines appear to be the same in terms of their steepness and direction.
7 In fact, any time two Lines share the same slope and are not the same line , they are parallel, and will never intersect. A B (0,0) 1(5,5) 1(0,-3) 2(3,0) 51 Both Lines pass through the origin, so only one additional point needs to be plotted for each line . line C: The point (-1,5) is chosen which, along with (0,0) gives the values 1 = 5, 2 = 0, 1 = -1, 2 = 0 = 2 1 2 1 = 0 50 ( 1) = 51 = -5 Here, the negative slope indicates that as the line increases along the x-axis, it decreases along the y-axis. line C s slope has a magnitude of 5; for every unit line C increases along the x-axis, it decreases 5 units along the y-axis.
8 line D: The points (-5,-1) and (0,0) on line D give the x- and y-values: 1 = -1, 2 = 0, 1 = -5, 2 = 0 = 2 1 2 1 = 0 ( 1)0 ( 5) = 15 line D has a positive slope that is less than 1. Keeping the slope in fraction form often makes it easier to see exactly how the line is behaving; for every 5 units it increases along the x-axis, it increases 1 along the y-axis. Also, notice that Lines C and D appear to be perpendicular, visually. In the same way Lines that are parallel share the same slope , the slopes of perpendicular Lines are the negative reciprocal of each other. Accordingly, calculating the slope of line C as the negative reciprocal of line D gives the same result as calculating it using the slope formula: = 1 = 1( 15)= 5 C D 1(-5,-1) 1(-1,5) (0,0) 52 slope of Horizontal and Vertical Lines Examining line C illustrated that as the magnitude of a line s slope increases, its direction gets closer to becoming vertical.
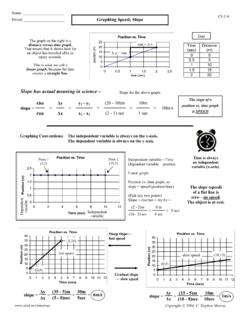
9 Similarly, examining line D illustrated that as the magnitude of a line decreases, approaching 0, its direction gets closer to becoming horizontal. Next, the slope of Lines that are completely horizontal or completely vertical will be examined. Example 4 Determine the slope of each of the Lines pictured below using the points given. line E: The points (4,0) and (4, 6) on line E give the x- and y-values: 1 = 0, 2 = -6, 1 = 4, 2 = 4 = 2 1 2 1 = 6 (0)4 4 = 60 Calculating the slope for line E illustrates that (due to division by 0) the slope of a vertical line is undefined. line F: The points ( 6,3) and (0,3) on line F give the x- and y-values: 1 = 3, 2 = 3, 1 = -6, 2 = 0 = 2 1 2 1 = 3 30 ( 6) = 06 = 0 Calculating the slope for line F illustrates that the slope of a horizontal line will be 0 divided by a non-zero number, which simplifies to 0.
10 No matter how far the line runs along the x-axis, there will be no rise along the y-axis. E F 1(-6,3) 2(0,3) 1(4,0) 2(4,-6) 53 Point- slope Form Expressing the equation of a line using point- slope form involves rearranging the slope formula slightly, and substituting values into the equation for the line s slope and a single point, anywhere on the line . Taking the line s slope , m, a point that is known on the line , ( 1, 1), and the general point, ( , ), the slope formula can be rearranged as follows: = 1 1 Multiplying both sides by ( 1) gives point- slope form. ( 1)= 1 It is more common, however, to see the equation reversed so that y-terms are on the left-hand side.