Transcription of Guide for Mechanistic-Empirical Design
1 Guide for Mechanistic-Empirical Design OF NEW AND REHABILITATED PAVEMENT STRUCTURES. FINAL DOCUMENT. APPENDIX CC-1: CORRELATION OF CBR VALUES WITH soil INDEX. PROPERTIES. NCHRP. Prepared for National Cooperative Highway Research Program Transportation Research Board National Research Council Submitted by ARA, Inc., ERES Division 505 West University Avenue Champaign, Illinois 61820. March 2001. I. Acknowledgment of Sponsorship This work was sponsored by the American Association of State Highway and Transportation Officials (AASHTO) in cooperation with the Federal Highway Administration and was conducted in the National Cooperative Highway Research Program which is administered by the Transportation Research Board of the National Research Council. Disclaimer This is the final draft as submitted by the research agency.
2 The opinions and conclusions expressed or implied in this report are those of the research agency. They are not necessarily those of the Transportation Research Board, the National Research Council, the Federal Highway Administration, AASHTO, or the individual States participating in the National Cooperative Highway Research program. Acknowledgements The research team for NCHRP Project 1-37A: Development of the 2002 Guide for the Design of New and Rehabilitated Pavement Structures consisted of Applied Research Associates, Inc., ERES Consultants Division (ARA-ERES) as the prime contractor with Arizona State University (ASU) as the primary subcontractor. Fugro-BRE, Inc., the University of Maryland, and Advanced Asphalt Technologies, LLC served as subcontractors to either ARA-ERES or ASU.
3 Along with several independent consultants. Research into the subject area covered in this Appendix was conducted at ASU. Foreword This appendix is a supporting reference to the pavement Design guidance presented in PART 2, Chapter 2 of the Design Guide . General correlations that describe the relationship between soil Index Properties and the California Bearing Ratio (CBR) and Resilient Modulus (MR) of unbound materials such as base, subbase, and subgrade layers are provided. II. APPENDIX CC-1: CORRELATION OF CBR VALUES WITH. soil INDEX PROPERTIES. Study Objective The objective of this study was to develop general correlations that describe the relationship between soil Index Properties and the California Bearing Ratio (CBR) and Resilient Modulus (MR) of unbound materials such as base, subbase, and subgrade layers in pavement systems.
4 The correlations developed are intended for use in the 2002 Design Guide methodology. Once relationships were developed to predict CBR values, the use of MR = 2555 was used to correlate properties directly to estimates of MR. Sources of Information The sources of information used to correlate CBR with soil index properties are: 1. Typical CBR ranges for USCS material classification (Table 1). 2. Grain Size Distribution ranges for materials defined with the unified soil classification system (USCS). Given the requirements of the USCS, each USCS symbol implies certain limits on the given size distribution. 3. Grain Size Distribution ranges for materials defined by AASHTO Classifications A-1-a, A-1- b, and A-3 materials. 4. Atterberg Limits for the USCS materials.
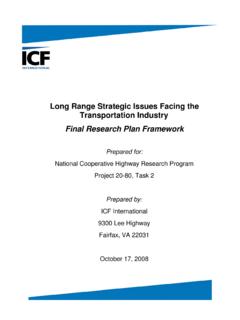
5 Likewise, each USCS symbol implies certain limits on the Atterberg Limits, particularly when the fact that most soils plot near the A- line is employed. Typical CBR ranges for the USCS materials were extracted from Principles of Pavement Design , (Yoder & Witczak, 1975). The values are shown in the 12th column of Table 1. Three additional CBR values for the AASHTO classification materials were extracted from a slightly modified version of the Guidelines for Use of HMA Overlays to Rehabilitate PCC Pavements (NAPA. Information Series 117, 1994). This modified graphical correlation of CBR, R-values, USCS, and AASHTO classification is shown in Figure 1. In addition, Tables 2 and 3 summarize the typical CBR and MR ranges, and default (typical) MR value for each USCS and AASHTO.
6 classification symbol. The grain size distribution information was used to define typical ranges for D60 values and the Percentage Passing #200 sieve (P200) for the USCS materials. These properties were chosen to correlate with CBR for simplicity, as they will always be required as input parameters in the 2002 Design Guide . Typical ranges for the Atterberg Limits were estimated in order to get the Plasticity Index (PI). As with the D60 and the P200 properties, the PI of the soil is always required as an input parameter in the Design Guide . The values of D60, P200, and PI were the index properties chosen for correlation. In addition, for materials with a PI > 0, a weighted Plasticity Index, termed wPI was used: wPI = Passing #200 Plasticity Index = P200 PI (1).
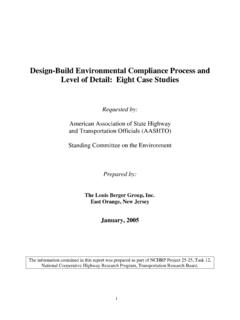
7 With P200 used as a decimal and PI used in % form Table 4 shows typical ranges of D60, P200, PI and wPI for the USCS and AASHTO materials. These values were obtained by checking the Plasticity chart and Grain Size distribution curves, based on the classification criteria, to obtain ranges. Methodology The materials were divided into two groups: a) Coarse materials, clean, typically non-plastic such as GW, GP, SW, and SP soils for which wPI = 0; and b) Soils which contain more than 12% fines and exhibit some plasticity, such as GM, GC, SM, SC, ML, MH, CL, and CH, for which wPI > 0. For coarse, clean soils (wPI = 0), it was decided to correlate the CBR value with the Diameter 60. (D60) from the grain size distribution curves. Figure 2 shows the data obtained from Tables 1.
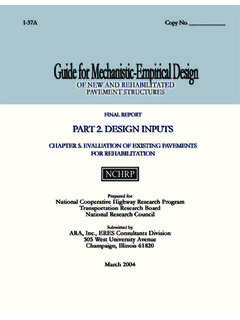
8 And 4 for non-plastic soils. Three additional data points were used based on the AASHTO. classification system corresponding to A-1-a, A-1-b, and A-3 soils. These data points were obtained from Figure 1 and are indicated by the legend for Figure 2. The best-fitted equation to the data shown in Figure 2 is the following: CBR = (D60) (2). Where: D60 = Diameter at 60% passing from the Grain Size Distribution mm Equation (2) is limited to D60 values greater than mm and less than 30 mm. For D60 less than mm, the recommended value of CBR is 5. For D60 greater than 30 mm, the recommended value of CBR is 95. This relationship is depicted in Figure 2, along with the goodness of the fit parameters. For the second group (plastic materials), for which wPI > 0, the index properties chosen to correlate with the CBR values are the Passing #200 sieve (P200) and the Plasticity Index (PI).
9 These properties are combined into a parameter called wPI, defined by Equation (1). Figure 3 shows the data obtained from Tables 1 and 2 for plastic materials (wPI > 0), along with the correlation and the goodness of fit. The correlation is represented by Equation (3), as follows: 75. CBR = (3). 1 + ( wPI ). Results Table 5 shows the calculated CBR based on Equations (2) and (3) for the different materials. Table 5 can either be included as a pop-up screen in the 2002 Design Guide software or simply presented in the User's Manual for the software, as a reference for the user. Validation As a preliminary validation of the correlations developed and depicted in Figures 2 and 3, the CBR values resulting from these correlations were compared to the ranges of CBR values recommended for materials defined by the USCS classification system in Figure 1 and Table 2.
10 It is important to note that the CBR ranges recommended in Figure 1 for the USCS materials were not used as a data source to develop the CBR correlations in this report. Therefore, it is a valid source for validation of the results obtained. Table 6 shows the CBR calculated by the correlations and the CBR ranges recommended in Figure 1 and Table 2. All of the CBR calculated values fall inside the range recommended, and therefore the correlations may be viewed as being quite reliable and consistent between all of the hierarchical sources of data used in the analysis. Summary 1. The correlations shown above were derived primarily by selecting specific values (from recommended ranges of values) of CBR, wPI, and D60. 2. These correlations were originally intended to get MRopt for frozen materials, so that Fenv could be computed (within the EICM Module) for frozen materials.