Transcription of GWSVM Algorithm for a Grid System - IJCSIT
1 GWSVM Algorithm for a grid System #1, *2, #3 #Department of CSE, CMR Engineering College, Hyderabad, India *Professor, Department of CSE, University College of Engineering,Osmania University, Hyderabad, India #Professor, Department of CSE, JNT University, Hyderabad, India Abstract This paper focuses on distributed data mining Algorithm that we propose GWSVM ( grid Weighted Support Vector Machine) Algorithm for our grid based System . In this we proposed a regression model based on weighted SVM for analytics purpose. Weighted SVM based regression model can predict the future out comes also based on present data. We test our Algorithm on our collected dataset and compare our results with SVM based model and Decision tree. GWSVM performs better compare with SVM based model. We focus on the data mining aspects of IMR (infant mortality rate) and MMR (maternal mortality rate) related to grid based health care System .
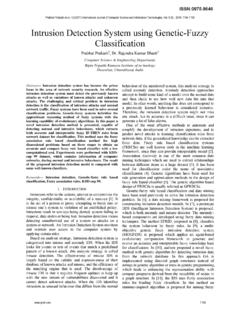
2 The paper discusses the importance of health care center and grid computing. The main objective is to reduce the number of deaths related to child and women thereby meeting the Millenium Development Goals. Keywords Distributed data mining, grid , SVM, WSVM, IMR, MDGs and MMR. I. INTRODUCTION In this world there are many environments which are distributed in nature. We need to analyze and monitor these distributed data sources for various distributed applications. Sometimes available resources and human factors control scalable solutions for distributed applications. Those kind of distributed architectures are needed which can focus on the distributed resources related to data, computing and communication in order to consume them in a near optimal fashion. In the Figure 1 below, we can visualize the distributed data mining framework.
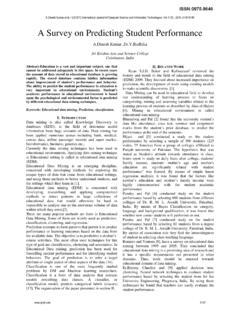
3 In this diagram the interconnection between data source and data mining Algorithm . There is connection of data mining Algorithm , local model, local model aggregation and final model. The decision in the DDM is generally based on the properties of computing, storage and communication capabilities. Fig. 1 Distributed Data Mining Framework II. DATA MINING APPROACHES There are two major steps in distributed systems to predict values first we collect the data and apply some pre-processing steps and extract some features. Then features are used to builds our predictive model. In this step we apply data mining Algorithm to build model based on extracted features from first stage. A. Decision tree based approach Decision tree-based models partition the operational space into rectangles. To divide into rectangle use a series of rules to identify regions which have most homogeneous responses.
4 They then fit a constant to each region with classification trees fitting the most probable class as the constant, and regression trees fitting the mean response for observations in that region, as Fig. 2 Decision tree based approach For example, in Figure 2 the two predictor variables X1 and X2 and the response Y. Regions Y1, Y2,etc. are terminal nodes or leaves, and t1, t 2, etc. are split points. Predictors and split points are chosen such a way that it minimizes prediction errors. Growing a tree involves recursive binary splits: a binary split means it repeatedly applied to its own output until some stopping criterion is reached. An effective strategy for fitting a single decision tree is to grow a large tree, and then prune it by collapsing the weakest links identified through cross validation (CV).
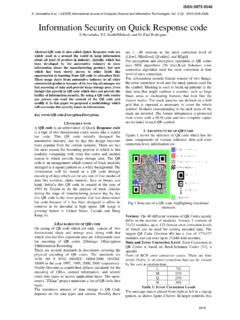
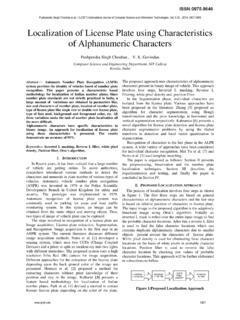
5 Et al, / ( IJCSIT ) International Journal of Computer Science and Information Technologies, Vol. 5 (5) , 2014, Regression based approach Regression [1][2][3]refers to relationship between one dependent variable and a series of other changing variables. The classification of regression can be into linear and non- linear . In linear regression the association between the dependent and independent variables is linear . Regression may be multiple or simple depending on the independent variables. Fig. 3 linear Regression A simple linear regression form is the form: In this case Y needs to be predicted. X is the independent variable where as, a is the intercept, b is the slope and u is the regression residual. It takes the following form: Nonlinear regression is other category. The association between the models is described in the form of a quadratic equation or any higher degree polynomial.
6 The data is fitted by a method of successive approximations. Fig. 4 Non - linear Regression To solve non- linear least squares problems the Gauss Newton Algorithm method is used. It has limitations for example the problem with Gauss Newtonian method is that it can only be used to minimize a sum of squared function values. The Gradient Descent Algorithm represents an extension of the normalized least mean square (NLMS) Algorithm by means of an additional gradient adaptive term in the denominator of the learning rate of NLMS. The Levenberg-Marquardt Algorithm is a combination of both Gauss Newtonian Algorithm and Gradient Descent Algorithm . Due to non- linear associations such algorithms are used. Even for higher degree of linearity the Gradient Descent Algorithm works. Even though we have many regression algorithms still we face many problems.
7 The data is very huge and the associations in them are complex when it comes to optical character recognition or image processing or voice recognition. Sometimes we have to compromise either on accuracy or time complexity. All these algorithms may not give us a generic regression model for the data. Sometimes whole model needs to be regenerated even if it means that even for a slightest change in the data. Support Vector Machine based Regression is developed to overcome all these problems. The solution is unique and optimum as there is no local minima. It also produces a generalized regression model based on the data. For small changes in the dataset the model need not be generated. Other benefit of this technique is that, the model can be generated even with small amounts of data.
8 C. Support Vector machine Regression Support Vector Machines [4][5][6][7][8] based on statistical learning theory, developed by Cortes and Vapnik (1995), has attracted attention and gained extensive application in classification and regression can handle multiple categorical and continuous attribute values. In the regression problem dataset X can be separated linearly by an optimal hyper plane which is also called maximal margin hyper plane. Data is non-linearly separable than it transforms the input data samples from low dimensional input space to a higher dimensional space that is known as feature space. For mapping the input data into higher dimensional space kernel function is used and then SVM constructs an optimal separating hyper plane in this higher dimensional feature space. A mathematical model is built using dataset which called training dataset.
9 Given a set of data points , such that xk Rnis an input and yk R is a target output, the linear SVM regression Algorithm tries to find the function f(x,w)= wx+b Where f is an unknown target function, b is the bias term; w is the weight factor, SVM regression equation as follows Subject to constraints Where C is a regularization parameter used to decide a trade-off between the training error and the margin. Xk is a vector of k-sample is dataset mapped to a higher dimensional space by the kernel function and 'k denotes the lower training error, and k is the upper training error depending on - insensitive band et al, / ( IJCSIT ) International Journal of Computer Science and Information Technologies, Vol. 5 (5) , 2014, Fig. 5 SVM constraints D. Weighted SVM model In the weighted SVM [4][5][6][7][8]based regression approach we add additional weight factors.
10 Weighted SVM equations are given below Where wi is the weight for the ith sample, 0 wi 1. Good fitting function can be got by choosing appropriate functional space. Here the weight of WSVM is taken as follows Where , p are prefixed positive constants. The new weight doesn t relate to the test samples, so it consumes shorter CPU time than general WSVM does. WSVM is superior to -SVM when there are some singularities in the training samples. But there should be a premise if this WSVM performs well. The premise is that the number of the singularities of the two sides of function curve should be similar, and the distance of singularities of the two sides to the function curve should be similar, or the fitted curve will direct towards one side with more and larger singularities. This makes the Algorithm short of bad generalization.