Transcription of Helium Spectrum Analysis Methods - Cal Poly Pomona
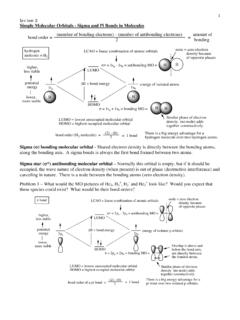
1 Helium Spectrum AnalysisIn this experiment we will measure the wavelengths emitted by hydrogen and he-lium with our Ocean Optics spectrometer. We will use the hydrogen Spectrum tocalibrate the spectrometer. Then, we will be able to obtain accurate measurementsof the Helium Spectrum . After collecting the Helium Spectrum data, we will comparethe Helium wavelengths to those of hydrogen to help us identify the will be collected using our Ocean Optics spectrometer using appropriatecollection times. If you are satisfied with the Spectrum , then save it in the coursedirectory.
2 The Spectrum will be analyzed using the data Analysis javascript located in the course directory and on my homepage. The programallows you to perform Gaussian curve fitting to obtain an accurate value for the optical Spectrum data is fundamentally different than the nuclear gammaspectrum data. In the case of the gamma detector, the photoelectric effect was themethod of detection and allowed us tocountthe photons. For the optical spectrome-ter, a diffraction grating uses interference effects to separate the different detector measures the intensity (classical) of the radiation.
3 We are not countingphotons with the optical spectrometer. The intensity in each channel is not aninteger, and does not necessarily obey Poisson shape of the peaks arenot necessarily CalibrationTake and save a hydrogen Spectrum . The wavelengths of the Balmer series tran-sitions are listed in the table below in order of their intensity. Use the table below toobtain a calibration equation between channel number and wavelength. To getan estimate of the uncertainty of the energy calibration, you can examine the residuesof the standards from the (ni nf)Wavelength (nm)3 AnalysisTake and save Helium spectra using a short collection time, for peaks with a largeintensity.
4 Then take and save Helium spectra using a long collection time for peakswith small intensities. Measure the channel number of the peaks. Use your calibra-tion equation to determine the wavelengths of the interesting way to analyze the data is to calculate all possible differences inenergy between the Helium and the hydrogen specrum lines. The energy of a photon isE=hf=hc/ . In units ofeV nm,hc= 1240eV nm. The energy differences canbe calculated using the following spreadsheet approach. The hydrogen wavelengthsare entered in the first row of the spreadsheet according to their initial principalquantum number,ni.
5 The Helium wavelengths are entered in the first column of thespreadsheet according to their relative intensity. Then fill the spreadsheet with theenergy differences Ejibetween all combinations of the emitted photons of hydrogenand Helium by entering the following formula in the spreadsheet: Eji=hc j(He) hc i(H)= 1240(1 j(He) 1 i(H))eVwhere j(He) is the Helium wavelength (in nm) in thej throw, and i(H) is thehydrogen wavelength (in nm) in thei thcolumn. Note thatjis not the index for thej thenergy level of the array for any patterns and check if there are common values of energydifferences.
6 After everyone has made the spreadsheet, we willdiscuss our results for Experiment 61. Turn in the data for the hydrogen spectra, which includes the channel number corresponding to the hydrogen wavelengths. Turn in the calibration graph, and thecalibration equation that relates wavelength to channel number . Determine theuncertainty of your calibration equation and discuss in detail how you estimated Turn in the data for the Helium spectra, which includes the channel number andthe corresponding wavelength of the peaks from your calibration Turn in your spreadsheet for all the energy difference combinations Ejiof thehydrogen and Helium emission Discuss your Analysis of the data.
7 You should be able to identify many transitions,and determine a singlet-triplet splitting in Helium . Labelthe transition in as manyHelium lines as you can usingjust your data. Each spectral line should be labelled inthe form: 6d 2p(singlet), 6d 2p(triplet), etc. Discuss how one can determinethe singlet-triplet splitting from the