Transcription of highlights 2016 - OECD
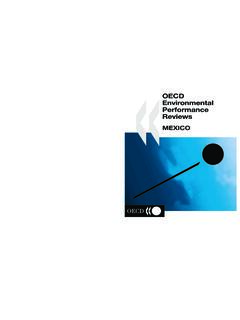
1 Chilehighlights2016 What are eprs?OECD environmental performance Reviews (EPRs) provide evidence-based analyses and assessments of countries progress towards their environmental policy promote peer learning, enhance government accountability and provide targeted recommendations to help countries improve their environmental performance . They are supported by a broad range of economic and environmental data. Each EPR cycle covers all OECD member countries and selected partner reports are available on the EPR website: second epr of chileThis is the second EPR of Chile. It focuses on the period since 2005, when the first environmental performance Review was released.
2 Chile joined the OECD in 2010. This Review was prepared by the OECD in co-operation with the United Nations Economic Commission for Latin America and the Caribbean (ECLAC). It involved a constructive and mutually beneficial policy dialogue between Chile and the countries participating in the OECD Working Party on environmental performance (WPEP).The EPR provides 54 recommendations, approved by the WPEP on 10 March 2016, to help Chile green its economy and improve its environmental governance and management, with a strong emphasis on climate change and biodiversity policies. Chile is an economic powerhouse in Latin America.
3 The question for the next quarter century is whether it will be able to continue to deliver solid economic growth in a way that protects its environmental asset base. simon Upton OECD Environment highlightsOverviewNatural resources are a pillar of Chile s open and market-oriented economy. Chile is the world s largest copper producer and a major exporter of agricultural, forestry and fishery products. Sustained economic growth and investment in environmental infrastructure have helped improve the well-being of the population over the last 15 years. However, Chile s natural resource-based economic model has started to show its limits.
4 Strong growth has been accompanied by increasing environmental pressures. In response, Chile has strengthened its environmental institutions and policy framework. Policies must be implemented rigorously over the next decade to fully deliver their positive effects on the environment. opportunities znew and stronger environmental institutions: a dedicated ministry, inspectorate and assessment agency. zlong experience in pricing water and fish resources, and recent tax reforms to tackle air pollution and climate change. zWidespread water supply and sanitation infrastructure networks in urban areas.
5 Za well-developed public transport system in the capital region. za third of chile s total energy needs covered by renewables. znearly a fifth of land area under nature protection and plans for establishing the largest marine park in the americas. challenges zthe most material-intensive oecd economy and an overreliance on the use of natural resources. zrising greenhouse gas emissions and vulnerability to climate change impacts. zpersistently high air pollution in large urban and industrial areas. zincreasing waste generation and continued reliance on landfills for disposal. za legacy of hundreds of abandoned mines and contaminated sites.
6 Zhigh pressures on biodiversity in the regions where mining, agriculture and urban development concentrate. zUnevenly distributed water resources and overexploited aquifers in some regions. zinsufficient institutional capacity and co-ordination across levels of government, hampering effective implementation and law enforcement. zhigh income inequality and rising socio- environmental tensions in local communities. chile 2015population milliongdp/capita(current purchasing power parity) USD 22 197(OECD average is 39 976)total area 756 096 km2population density24 inhabitants/km (OECD average is 35)currencyChilean peso USD = CLP extends over nearly 4 300 km along south america s western coast.
7 Its geography and climate vary greatly, with an extremely dry north, temperate Mediterranean climate and rich vegetation in the central and southern regions, and subpolar forests and icefields in the extreme south. chilean regions face different environmental challenges as they boast diverse natural resource endowments, population densities and economic structures: most people live in the central regions; mining concentrates in the north, forestry and agriculture in the centre, and fishery in the south. oecd environmental performance rEviEw Of ChiLEenergy and climate change zThe economy used 54% more energy in 2014 than in 2000, with rapid economic growth, increased mining and industrial production and growing transport demand.
8 Nonetheless, per capita energy use is significantly lower than in other OECD countries, reflecting the remaining income gap. zEnergy production from renewable sources has doubled since 2000, although not quickly enough to satisfy rising energy demand (see figure 1). Renewables account for 32% of energy supply, the fifth highest share in the OECD, and 40% of electricity generation. Hydropower and firewood for residential heating are the main renewable sources; wind and solar are small but growing fast (see page 11). Yet, Chile has increasingly used carbon-intensive fuels such as coal and oil to generate electricity.
9 ZGreenhouse gas (GHG) emissions (excluding land use, land-use change and forestry) increased by 23% in 2000-10, and are expected to continue rising, in line with economic growth, energy use and transport demand (see page 12). figure 1. renewables increased fast, but chile s energy mix relies on fossil fuelstotal primary energy supply. Source: iEa (2015), IEA World Energy Statistics and Balances (database).figure 2. the vehicle fleet has doubled since 2000, increasing air pollution0102030402000200220042006200820 1020122014 GDP 2000 = 100 MtoeRenewables 32% Natural gas 10%Oil 40%Coal 18%GDP2014 = 178 Chile s energy supply in 2014(biomass and biofuels 27%, hydro 5%, solar and wind )2000: 2 million cars2014: million cars1 = 100 000 cars.
10 Passenger cars, vans, minibuses, buses, and goods vehicles. Source: inE (2015), Anuarios parque de vehiculos en performance | key developments 5 highlights zDevelop, implement, evaluate and update Pollution Prevention and Decontamination Plans in all areas that exceed air quality standards. zimprove air quality monitoring networks and make air pollution information available to the public. zContinue to invest in urban public transport systems to address increasing travel demand, congestion and emissions of air pollutants and GhGs. zSwiftly implement the waste framework law and the extended producer responsibility schemes.