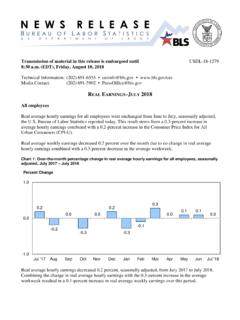
Transcription of Houston Economic Indicators YEAR-TO-DATE …
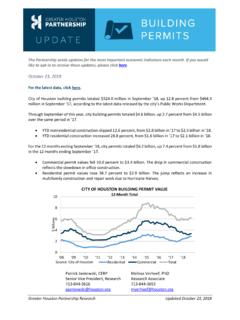
1 Houston Economic IndicatorsN = New Since Previous Issue6/22/2018R = RevisedA Service of the Greater Houston PartnershipMostYear%MostYear% Active Rotary RigsApr '18991 789 *742 * Crude Oil Price ($/bbl, West Texas Intermediate)Apr ' * * Natural Gas ($/MMBtu, Henry Hub)Apr ' * * AND PRODUCTIONH ouston Purchasing Managers IndexMay ' * * Electric Current Sales (Mwh, CNP Service Area)Apr '18N5,426,067 5,002,679 ,988,236 23,168,121 Building Contracts ($, Houston MSA)Apr '181,575,180,000 1,086,270,000 ,001,624,000 6,130,652,000 '18644,451,000 347,414,000 ,138,292,000 3,145,274,000 '18930,729,000 738,856,000 ,863,332,000 2,985,378,000 Permits ($, City of Houston )Apr '18468,156,818 484,964,178 ,758,754,025 1,981,018,370 '18190,800,631 262,986,485 ,303,249 1,268,100,834 NonresidentialApr '1857,003,855 54,158,695 ,071,506 413,620,108 Additions/Alterations/ConversionsApr '18133,796,776 208,827,790 ,231,743 854,480,726 '18277,356,187 221,977,693 ,450,776 712,917,536 ResidentialApr '18236,861,798 194,469,151 ,826,641 616,774,096 Additions/Alterations/ConversionsApr '1840,494,389 27,508,542 ,624,135 96,143,440 SALESM ultiple Listing Service (MLS)
2 ActivityProperty SalesMay '189,721 9,660 ,266 37,388 Sales Price - SF DetachedMay '18243,000 235,000 ,562 *224,800 * ListingsMay '1839,478 40,058 ,877 *36,941 * ( Houston -The Woodlands-Sugar Land MSA)Nonfarm Payroll Employment May '183,097,500 3,013,000 ,066,500*2,994,750 * Producing (Natural Resources/Mining/Const/Mfg)May '18534,100 510,600 ,225*508,750 * ProvidingMay '182,563,400 2,502,400 ,539,275*2,486,000 * Rate (%) - Not Seasonally AdjustedHouston-Sugar Land-Baytown MSAMay ' * *TexasMay ' * * ' * *FOREIGN TRADE ( Houston -Galveston Customs District)Total Trade ($000,000)Mar '1819,440 16,280 ,635 46,606 ($000,000)Mar '1811,676 9,150 ,362 26,657 ($000,000)Mar '187,764 7,130 ,273 19,949 of Houston Authority Shipments (Short Tons)Mar '184,377,236 4,003,862 ,224,789 19,289,015 Passengers ( Houston Airport System)Mar '184,935,456 4,692,517 ,312,917 12,937,463 PassengersMar '183,899,763 3,731,091 ,516,167 10,229,589 PassengersMar '181,035,693 961,426 ,796,750 2,707,874 Freight (metric tons)Mar '1843,907 37,796 ,465 106,176 Car and Truck Sales (Units, Houston MSA)
3 May '18N23,720 26,117 ,576 118,557 '18N7,213 8,758 ,917 39,837 , SUVs and CommercialsMay '18N16,507 17,359 ,659 78,720 Retail Sales ($000,000, Houston MSA, NAICS Basis)Q3/1728, , , 81, Price Index for All Urban Consumers ('82-'84=100) Houston -Galveston-Brazoria CMSAApr ' * * StatesMay ' * * Performance ( Houston MSA)Occupancy (%)Q4 *Average Room Rate ($)Q4 * Per Available Room ($)Q4 * CountBaker Hughes IncorporatedSpot WTI, Spot Natural Energy Information AdministrationHouston Purchasing Managers IndexInstitute for Supply Management - Houston , Energy (CNP)Building Construction ContractsDodge Data and AnalyticsCity of Houston Building PermitsBuilding Permit Department, City of HoustonMLS DataHouston Association of RealtorsEmploymentTexas Workforce CommissionPort ShipmentsPort of Houston AuthorityAviationAviation Department, City of HoustonNew Car and Truck SalesTexAuto Facts Report, InfoNation, Inc.
4 , Sugar Land TXRetail SalesState Comptroller's OfficeConsumer Price Bureau of Labor StatisticsHotelsCBRE HotelsForeign Census BureauMONTHLY DATAYEAR-TO-DATE TOTAL orYTD AVERAGE*