Transcription of HOW TO DEVELOP A GRAPHICAL SER NTERFACE …
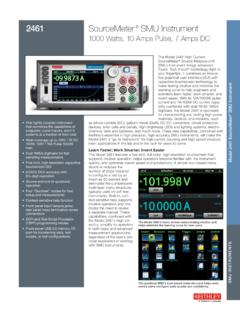
1 Powered by HOW TO DEVELOP A GRAPHICAL USER INTERFACE (GUI) IN SCILAB. In this tutorial we show how to create a GUI in Scilab for an ODE problem. The adopted problem is the LHY model already used in other tutorials. Level This work is licensed under a Creative Commons Attribution-NonCommercial-NoDerivs Unported License. LHY Tutorial Gui page 2/18 Step 1: The purpose of this tutorial In this tutorial we show, step by step, how to create a GRAPHICAL User Interface (GUI)in Scilab. Examples of Scilab GUIs are reported on the right. These images are taken from the GUI menu of the Scilab Demonstrations. Step 2: Model description In this tutorial we refer to the LHY model. A description of the LHY model and its solution using ode command can be found in the basic tutorial of modeling differential equations in Scilab. LHY Tutorial Gui page 3/18 Step 3: Roadmap In this tutorial we describe how to construct a GUI for the LHY.
2 We implement the system in the following way: Provide a description of GUI programming in Scilab; Implement the GUI for the LHY model; Test the program and visualize the results. Descriptions Steps GUI programming in Scilab 4-5 GUI for the LHY model 6-17 Running and testing 18-19 Step 4: Scilab GUI programming A GUI is a human-computer interface that uses GRAPHICAL objects like windows, menus and icons to interact with users through the use of mouse and keyboard (often in a limited way). The main advantage of using GUIs is the ability to make computer operations more intuitive, and thus easier to learn and use especially for new users. For example, it is much easier to move files by dragging icons with the mouse than by having to remember the command that performs the same task. The function that creates a GRAPHICAL user interface object in Scilab is "uicontrol". The syntax of the GUI function is h = uicontrol(PropertyName,PropertyValue.)
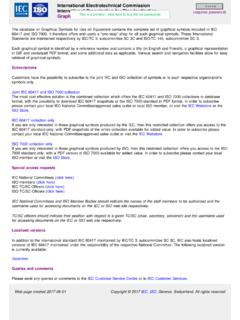
3 H = uicontrol(parent,PropertyName,PropertyVa lue,..) h = uicontrol(uich) For a detailed description see "help uicontrol". LHY Tutorial Gui page 4/18 Step 5: Design of the GUI interface The first step is to design the skeleton of the GUI interface for the LHY model. Designing a correct GUI is not a trivial task. Many rules exist and can be found in textbooks and web sites dedicated to this subject. On the right we report our scheme for the LHY GRAPHICAL user interface where: "Model parameters" contains the list of all LHY model parameters that the user can change; "Time Setting" contains the list of all time simulation variables; "Initial conditions" contains the list of all initial conditions for the ODE problem; " GRAPHICAL plot " contains the plot of the simulation s results; "Compute button" updates the solution in the " GRAPHICAL plot "; The menu "file" contains the entry "close" that is used to close the program; The menu "About" contains the entry "About" that is used to display some info about program and author.
4 LHY Tutorial Gui page 5/18 Step 6: Storing default parameters The first step is to store all the default LHY model parameters into mlist Scilab objects. The parameters are subdivided into two groups: the "param" group for the LHY model parameters; the "sim" group for the simulation time parameters and initial conditions. // Default simulation parameters param = []; = 5e4; // Number of innovators per year (initiation) = ; // Annual rate at which light users attract non-users (initiation) = ; // Constant which measures the deterrent effect of heavy users (initiation) = ; // Lower bound for s effective (initiation) = ; // Annual rate at which light users quit = ; // Annual rate at which light users escalate to heavy use = ; // Annual rate at which heavy users quit = ; // Forgetting rate // Simulation data // Time variables sim = []; = 1970; // Initial time = 2020; // Final time = 1/12; // Time step // Initial conditions = ; // Light users at the initial time = ; // Heavy users at the initial time = ; // Decaying heavy user at the initial time The name of the developed function is "LHY_Gui".
5 LHY Tutorial Gui page 6/18 Step 7: Create an initial window In the next step we create, with the "scf" Scilab function, an initial window where GRAPHICAL object can be added. The function "gettext" is used for internationalization ( i18n, it translates the text into the current local language if available). // Global window parameters global margin_x margin_y; global frame_w frame_h plot_w plot_h; // Window Parameters initialization frame_w = 300; frame_h = 550;// Frame width and height plot_w = 600; plot_h = frame_h;// Plot width and heigh margin_x = 15; margin_y = 15;// Horizontal and vertical margin for elements defaultfont = "arial"; // Default Font axes_w = 3*margin_x + frame_w + plot_w;// axes width axes_h = 2*margin_y + frame_h; // axes height (100 => toolbar height) demo_lhy = scf(100001);// Create window with id=100001 and make it the current one // Background and text = -2; = [100 100]; = gettext("LHY solution"); // Change dimensions of the figure = [axes_w axes_h]; Type help scf for more details on the scf command.
6 LHY Tutorial Gui page 7/18 Step 8: Set menu and toolbar After creating the window, we create the menu. The used function are: "addmenu"/"delmenu": for adding or removing a menu from the menu bar; "uimenu": for creating a menu or a submenu in a figure. Associate to each menu entry there is a callback, a reference to a executable function that is activated when the user select the entry. // Remove Scilab graphics menus & toolbar delmenu( ,gettext(" delmenu( ,gettext(" delmenu( ,gettext(" delmenu( ,gettext(" toolbar( ,"off"); // New menu h1 = uimenu("parent",demo_lhy, "label",gettext("File")); h2 = uimenu("parent",demo_lhy, "label",gettext("About")); // Populate menu: file uimenu("parent",h1, "label",gettext("Close"), "callback", "demo_lhy=get_figure_handle(100001);dele te(demo_lhy);", "tag","close_menu"); // Populate menu: about uimenu("parent",h2, "label",gettext("About"), "callback","LHY_About();"); // Sleep to guarantee a better display (avoiding to see a sequential display) sleep(500); An import field for the GRAPHICAL function is the parent field the handle where the GRAPHICAL object should be attached, in our case demo_lhy.))))))))
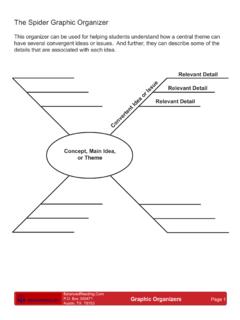
7 Changing this value allows to move a control from a figure to another. See uimenu help file for more details. LHY Tutorial Gui page 8/18 Step 9: About dialog The About dialog is a modal dialog created using the "messagebox" function. Two types of windows are available: "modal dialog": in a modal window users are required to interact with it before it returns to the parent application. "modeless dialog": in modeless or non-modal window the request information is not essential to continue with the program. A non-modal window can be left open while work continues elsewhere. function LHY_About() msg = msprintf(gettext("LHY is developed by the Openeering Team.\nAuthor: M. Venturin")); messagebox(msg, gettext("About"), "info", "modal"); endfunction Step 10: Creating a frame A frame is GRAPHICAL object used to group other objects. // Frames creation [LHY parameters] my_frame = uicontrol("parent",demo_lhy, "relief","groove".)
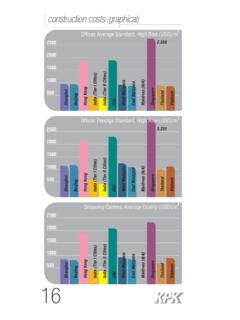
8 "style","frame", "units","pixels", .. "position",[ margin_x margin_y frame_w frame_h], .. "horizontalalignment","center", "background",[1 1 1], .. "tag","frame_control"); // Frame title my_frame_title = uicontrol("parent",demo_lhy, "style","text", .. "string","LHY parameters", "units","pixels", .. "position",[30+margin_x margin_y+frame_h-10 frame_w-60 20], .. "fontname",defaultfont, "fontunits","points", .. "fontsize",16, "horizontalalignment","center", .. "background",[1 1 1], "tag","title_frame_control"); LHY Tutorial Gui page 9/18 Step 11: Populate the frame Each parameters is composed of the following elements: a string that denote the parameter (style text ); an edit box (style edit ) that is used as an input/output mask (the input is recovering by searching all GRAPHICAL objects having that tag, and hence the tag must be unique among the elements) // Adding model parameters guih1 = frame_w; guih1o = 240; // ordered list of labels labels1 = ["Tau", "s", "q", "smax", "a", "b", "g", "delta"]; // ordered list of default values values1 = [5e4, , , , , , , ]; // positioning l1 = 40; l2 = 100; l3 = 110; for k=1:size(labels1,2) uicontrol("parent",demo_lhy, "style","text".
9 "string",labels1(k), "position",[l1,guih1-k*20+guih1o,l2,20], .. "horizontalalignment","left", "fontsize",14, .. "background",[1 1 1]); guientry1(k) = uicontrol("parent",demo_lhy, "style","edit", .. "string",string(values1(k)), "position",[l3,guih1-k*20+guih1o,180,20] , .. "horizontalalignment","left", "fontsize",14, .. "background",[.9 .9 .9], "tag",labels1(k)); end LHY Tutorial Gui page 10/18 Step 12: Continue with the frame As previously done, we continue to add GRAPHICAL components for simulations parameters and initial conditions. // Adding simulation paramters guih2 = 240; guih2o = 80; labels2 = ["Tbegin", "Tend", "Tstep"]; values2 = ["1970", "2020", "1/12"]; l1 = 40; l2 = 100; l3 = 110; for k=1:size(labels2,2) uicontrol("parent",demo_lhy, "style","text", .. "string",labels2(k), "position",[l1,guih2-k*20+guih2o,l2,20], .. "horizontalalignment","left", "fontsize",14.
10 "background",[1 1 1]); guientry2(k) = uicontrol("parent",demo_lhy, "style","edit", .. "string",values2(k), "position",[l3,guih2-k*20+guih2o,180,20] , .. "horizontalalignment","left", "fontsize",14, .. "background",[.9 .9 .9], "tag",labels2(k)); end // Adding initial conditions guih3 = 150; guih3o = 80; labels3 = ["L0", "H0", "Y0"]; values3 = [ , , ]; l1 = 40; l2 = 100; l3 = 110; for k=1:size(labels3,2) uicontrol("parent",demo_lhy, "style","text", .. "string",labels3(k), "position",[l1,guih3-k*20+guih3o,l2,20], .. "horizontalalignment","left", "fontsize",14, .. "background",[1 1 1]); guientry3(k) = uicontrol("parent",demo_lhy, "style","edit", .. "string",string(values3(k)), "position",[l3,guih3-k*20+guih3o,180,20] , .. "horizontalalignment","left", "fontsize",14,.. "background",[.9 .9 .9], "tag",labels3(k)); end LHY Tutorial Gui page 11/18 Step 13: Add a button Next, using the same command uicontrol , we add the compute button (style pushbutton ): // Adding button huibutton = uicontrol(demo_lhy, "style","pushbutton".