Transcription of How to do Value Stream Mapping - Lifetime …
1 How to do Value Stream Mapping CONTENTS Abstract .. 2 What is Value Stream Mapping ? .. 2 Value Stream Mapping Methodology .. 4 Investigation .. 7 Analysis .. 7 Identifying Improvements .. 7 Mike Sondalini Lifetime Reliability Solutions Email: Fax: (+ 61 8) 9457 8642 Mob/Cell: 0402 731 563 2 How to do Value Stream Mapping Abstract Value Stream Mapping has the reputation of uncovering waste in manufacturing, production and business processes by identifying and removing or streamlining non- Value -adding steps. A flow diagram showing the process is drawn to reflect the current state of the operation. The non- Value actions are identified in each step and between each step by their waste of time and resources. The process is analysed for opportunity to drastically reduce and simplify it to the fewest actions necessary.
2 By reducing wastefulness the proportion of Value adding time in the whole process rises and the process throughput speed is increased. This makes the redesigned process more effective (the right things are being done) and more efficient (needing fewer resources). The reengineered process is flow charted in its future state with process steps and information flows redesigned, simplified and made less expensive. What is Value Stream Mapping ? The use of Value Stream Mapping (VSM) has been attributed to the cause of much of the success that Toyota of Japan has had since the 1980 s1. Developed during the work conducted by Taiichi Ohno at Toyota in the 1960 s and 70 s, at its basic level VSM is a systematic methodology to identify wasted time and actions in a manufacturing process.
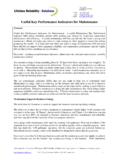
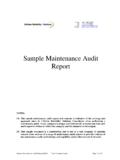
3 In more recent times VSM it has been used to re-engineer businesses because it identifies unnecessary effort and resources to permit simplification and streamlining of operations processes. In Taiichi Ohno s words - All we are doing is looking at the time line from the moment the customer gives us an order to the point when we collect the cash. And we are reducing that time line by removing the non- Value -added wastes. (Ohno, 1988) It is useful to explain the meaning of several key concepts used in VSM. These are: what is meant by a process, what waste is, what is meant by flow , what constitutes Value -adding, along with what is needless non- Value -adding and what is necessary non- Value -adding. A process is a series of activity steps that move inventory from one step to the next to transform it into the intended output, as shown in Figure 1.
4 The output could be a physical item or a service. A process can be any type or size and cover any period of time. Each step in a process also consists of processes within the step. VSM is used to investigate processes to identify improvement opportunities lying in their wastefulness and lack of fluidity. Waste is one of the seven wastes identified by Toyota. These are: Step 1 Step 2 Step 3 Step 4 Process Output Figure 1 A Process Consisting of Activity Steps with Inventory Moving Through the Process I Inventory from Step 1 I I I Inventory from Step 2 Inventory from Step 3 Inventory from Step 4 Within each step is another process. 3 1. Overproduction: Producing items for which there are no orders. 2. Waiting Time: Employees standing about.
5 Inventory at stand-still. 3. Unnecessary Transport: Moving material unnecessarily or long distances. 4. Over-processing: Using more steps to produce a product than necessary. 5. Excess Inventory: Retaining unnecessary inventory between process steps. 6. Unnecessary Movement: Any wasted motion by man or machine. 7. Defect: Making incorrect product. Flow is the continuous movement of inventory from step to step in a smooth, steady pattern and level rate. Toyota says that when the process is right production flows like water . Value is from the customer s perspective, the customer being the person who uses the output. Value -adding actions and resources are those which create Value for the customer. Non- Value -adding is everything done in the process which contributes no Value for the customer but which they are forced to pay for when they buy the product or service.
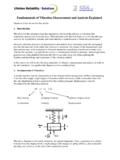
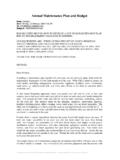
6 Figures 2 and 3 shows a situation in a truck chassis assembly process where Value is added and lost for the customer. Necessary non- Value -adding are those actions in a process that must be done to make the product but create no Value for the customer. Unnecessary non- Value -adding is removed and necessary non- Value -adding is minimised to the least possible. 1. Drop carton of components at assembly line 2. Walk 8 meters to pick-up components 3. Remove carton wrap to expose components 4. Reach into carton and grab components 5. Orient components so they can be picked up 6. Pick up bolts for component 7. Walk 8 meters to the chassis on the assembly line 8. Position components on the chassis 9. Walk to power tool 10. Reach for power tool 11.
7 Walk and pull power tool to the component on the chassis 12. Bring power tool down to component 13. Place bolts in the component 14. Tighten the bolts to the chassis with power tool 15. Walk 8 meters to pick-up next components 1 2 3 4 6 8 5 7 9 10 12 11 13 14 15 Figure 3 Value -Add and Non- Value -Add Time in Chassis Assembly Time Value -Add Time Non- Value -Add Time Start Finish Figure 2 Waste in a Truck Chassis Assembly Process 4 Value Stream Mapping Methodology In VSM we follow a process from start to finish monitoring and measuring what happens within, and between, each process step. For each process step we record the variety of resources used in the step, the amount of their usage and the range of times each resource is in use as a block of information specific to that step.
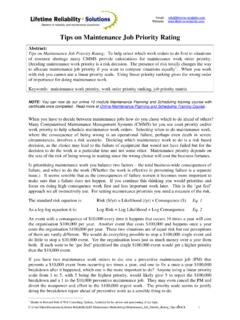
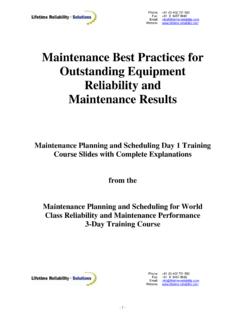
8 The measured variables are collected together in a variable block as shown in Figure 4. Note the spread, or variation, of the variables is recorded and not just the average. The presence of variability offers great opportunity for improvement. From the information collected during data gathering the process is drawn as a flow diagram showing the times and resources used at each step and the time delay between each step. This diagram is called the current state map , an example is shown in Figure 8. The current state map of Figure 8 is the straight bar manufacturing process for steel reinforcing bar used in strengthening concrete structures. Bundles of straight steel bar are off-loaded from trucks into storage racks and wait to be cut.
9 When bar of a particular diameter is needed the steel is taken to the cutting machine shown in Figures 5, 6 and 7 and cut to length. It is then conveyed and fed into the collection pockets. Once the required numbers of steel bars are in the pocket they are wire-wrapped together into a bundle to stop bars sliding about for reasons of safety and ease of moving. The bundle is then removed from the pocket and stored in a rack until loaded on a truck to be taken to the construction site early each working day morning. Figure 8 shows the use of variable blocks to capture relevant information about each step. Inventory movements between steps are identified by the I inside a triangle. Under the triangle is noted the range of times (quickest, average, longest) the inventory can take to be moved.
10 A visualisation of the location of Value -add and non- Value -add steps is presented as a line across the bottom of the page which jumps up during a Value -adding step and stays low for all other times. The current state map is scrutinised step by step to identify which of the functions and actions performed in the step/process add customer- Value and which do not. The non- Value -adding actions and resources are analysed to find where they can be minimised through time-saving and cost-saving improvements. A secondary benefit of timing the process steps and measuring the rate of throughput is identification of the bottleneck step(s). The bottlenecks can be redesigned to lift their capacity and so increase the output rate of the whole process.