Transcription of Tips on Maintenance Job Priority Rating - Lifetime …
1 Email: Website: C:\Users\Mike\Documents\ Lifetime Reliability\LRS Maintenance Methodology\ 1 Masters of reliability and Maintenance excellence Tips on Maintenance Job Priority Rating Abstract: Tips on Maintenance Job Priority Rating : To help select which work orders to do first in situations of resource shortage many CMMS provide calculations for Maintenance work order Priority . Deciding Maintenance work Priority is a risk decision. The presence of risk totally changes the way to allocate Maintenance job Priority if you want to compare situations equally1. When you work with risk you cannot use a linear Priority scale. Using linear Priority ranking gives the wrong order of importance for doing Maintenance work. Keywords: Maintenance work Priority , work order Priority ranking, job Priority matrix NOTE: You can now do our online 10 module Maintenance Planning and Scheduling training course with certificate once completed.
2 Read more at Online Maintenance Planning and Scheduling Training Course. When you have to decide between Maintenance jobs how do you chose which to do ahead of others? Many Computerised Maintenance Management Systems (CMMS) let you use asset Priority and/or work Priority to help schedule Maintenance work orders. Selecting when to do Maintenance work, where the consequence of being wrong is an operational failure, perhaps even death in severe circumstances, involves a risk scenario. Deciding which Maintenance work to do is a risk based decision, as the choice may lead to the failure of equipment that would not have failed but for the decision to do the work at a particular time and not some other. Maintenance Priority depends on the size of the risk of being wrong in waiting since the wrong choice will cost the business fortunes. In prioritising Maintenance work you balance two factors the total business-wide consequences of failure, and when to do the work (Whether the work is effective in preventing failure is a separate issue.)
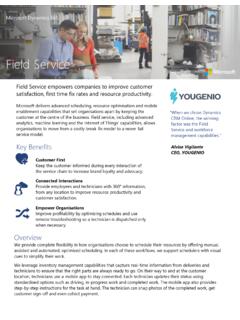
3 It seems sensible that as the consequences of failure worsen it becomes more important to make sure that a failure does not happen. If you continue this thinking you would prioritise and focus on doing high consequence work first and less important work later. This is the gut feel approach we all instinctively use. For setting Maintenance priorities you need a measure of the risk. The standard risk equation is: Risk ($/yr) = Likelihood (/yr) x Consequence ($) Eq. 1 As a log-log equation it is: Log Risk = Log Likelihood + Log Consequence Eq. 2 An event with a consequence of $10,000 every time it happens that occurs 10 times a year will cost the organisation $100,000 per year. Another event that costs $100,000 and happens once a year costs the organisation $100,000 per year. These two situations are of equal risk but our perceptions of them are vastly different.
4 We would do everything possible to stop a $100,000 single event and do little to stop a $10,000 event. Yet the organisation loses just as much money over a year from both. If each were to be gut feel prioritised the single $100,000 event would get a higher Priority than the $10,000 event. If you have two Maintenance work orders to do; one a preventive Maintenance job (PM) that prevents a $10,000 event from occurring ten times a year, and one to fix a once-a-year $100,000 breakdown after it happened, which one is the more important to do? Anyone using a linear Priority scale from 1 to 5, with 5 being the highest Priority , would likely give 5 to repair the $100,000 breakdown and a 1 to the $10,000 preventive Maintenance job. They may even cancel the PM and divert the manpower and effort to the $100,000 urgent work. The Priority scale seems to justify doing the breakdown repair ahead of preventive work as a sensible thing to do.
5 1 Thanks to Howard Witt of Witt Consulting, Sydney, Australia for his advice and questioning of my logic. Email: Website: C:\Users\Mike\Documents\ Lifetime Reliability\LRS Maintenance Methodology\ 2 Masters of reliability and Maintenance excellence But each scenario involves business risk and must be ranked by its risk Priority and not a linear Priority . Risk ranking is vastly different to work prioritised by linear scale. With risk based Priority ranking you develop a risk table using a log10-log10 scale. Equation 2 is the risk equation as a log10 formula. To find the log10 value for the risk we add together the log10 numbers for Likelihood and Consequence. The log10 of 10 is 1 (101), of 100 it is 2 (102), of 1,000 it is 3 (103), and so on. Notice that the log10 value is the same number as the exponent, which allows us to simplify notation to 1, 2, 3, etc.
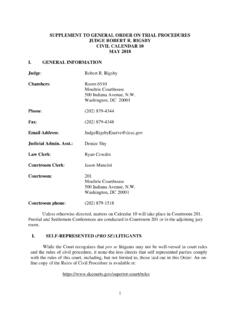
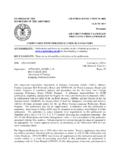
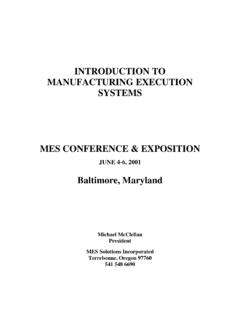
6 As long as we always use log10 we know that each number is ten times different to its neighbours. The values in the cells of Table 1 are calculated with Equation 1 and are the annual cost of carrying a level of risk. In Table 2, consequence and likelihood changes ten times in value with each number, so that 2 is ten times 1, 3 is ten times 2, 5 is ten thousand times 1, and so on2. Consequence (Cost per Event) Likelihood (Frequency) Negligible Minor Important Major Severe Disaster Likelihood of Event Event Count per Year $10 $100 $1,000 $10K $100K $1,000K Certain 10 $100 /yr $1K /yr $10K /yr $100K /yr $1,000K /yr $10,000K /yr Almost Certain 1 $10 /yr $100 /yr $1K /yr $10K /yr $100K /yr $1,000K /yr Possible (once in 10 yrs) $1 /yr $10 /yr $100 /yr $1K /yr $10K /yr $100K /yr Rare (once in 100 yrs) $ /yr $1 /yr $10 /yr $100 /yr $1K /yr $10K /yr Very Rare (once in 1000 yrs) $ /yr $ /yr $1 /yr $10 /yr $100 /yr $1K /yr Table 1 Financial Value of Risk The cell values in Table 2 sum log10 likelihood and log10 consequence and also represent the risk.
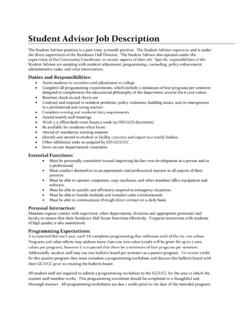
7 They correspond to the scale of impact. Though not the actual log10 value from using Equation 2 they are still signify multiples of ten. The table ranks business risk importance. The same numbers in cells represent the same amount of risk. The colours represent the levels of risk. This approach is standard risk management methodology and commonly used in industry to determine occupational health and safety risk. Risk Level Consequences Red = Extreme Safety: Describe Negligible through to Disaster events Amber = High Environmental: Describe Negligible through to Disaster events Yellow = Medium Reputation: Describe Negligible through to Disaster events Green = Low Financial: Describe Negligible through to Disaster costs Blue = Slight Other: Describe Negligible through to Disaster events Likelihood of Event Event Count per Year Negligible Minor Important Major Severe Disaster 1 2 3 4 5 6 Certain 10 5 6 7 8 9 10 11 Almost Certain 1 4 5 6 7 8 9 10 Possible (once in 10 yrs) 3 4 5 6 7 8 9 Rare (once in 100 yrs) 2 3 4 5 6 7 8 Very Rare (once in 1000 yrs) 1 2 3 4 5 6 7 Table 2 - Risk Value of an Event 2 AS4360:2004 Australian Risk Management Standard Email: Website: C.
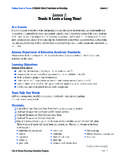
8 \Users\Mike\Documents\ Lifetime Reliability\LRS Maintenance Methodology\ 3 Masters of reliability and Maintenance excellence When the method is used for Maintenance work Priority the consequences remain the same but we need to find words that represent the likelihood of failure if the work is not done. Maintenance work can be broadly grouped into PM work done to a schedule based on usage and/or time, and work requested that reflects changing fortunes and problems in an operation. Table 3 shows an attempt to use words to describe the likelihood impact of Maintenance work. If the item is already failed it is a breakdown. But it does not mean you do a breakdown job if there is higher Priority work. A risk table makes it clear which Maintenance work is more important for the business and so you are less inclined to simply respond to the most insistent person, or to misunderstand what risk a job really is and where you ought to put your priorities.
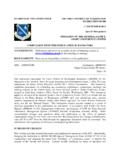
9 It is vital to remember that the risk scale is in multiples of ten. Each number is ten times the impact of its neighbours. A Maintenance job with a risk Priority of 8 is not twice the importance of one given a Priority of 4, which is what a linear scale implies (on a linear scale 4 is half of 8), it is 10,000 times more risky (where 10,000 x 10,000 = 10,000,000 104 x 104 = 108 and as log10 4 + 4 = 8). Understanding work risk Priority ranking is vital if you want to do Maintenance that paybacks the greatest value to your business. Risk Level Consequences Red = Extreme Safety: Describe Negligible through to Disaster events Amber = High Environmental: Describe Negligible through to Disaster events Yellow = Medium Reputation: Describe Negligible through to Disaster events Green = Low Financial: Describe Negligible through to Disaster costs Blue = Slight Other.
10 Describe Negligible through to Disaster events Impact Of Work Order Delay Negligible Minor Important Major Severe Disaster PM Work Requested Work 1 2 3 4 5 6 Certain to have negative consequences if not done by scheduled date Item has failed or failure is imminent 5 6 7 8 9 10 11 Almost certain to have negative consequences if done later than schedule No adverse consequences if done within 1 3 days of request date 4 5 6 7 8 9 10 Possible to have negative consequences if rescheduled to next scheduled date No adverse consequences if done within 10 14 days 3 4 5 6 7 8 9 Rare to have negative consequences if rescheduled to next scheduled date No adverse consequences if done within 2 3 months 2 3 4 5 6 7 8 Very rare to have negative consequences if rescheduled several times No adverse consequences if done within 2 3 years 1 2 3 4 5 6 7 Table 3 - Log-Log of Maintenance Work Risk You can even go a step further and advise people how you want them to behave in response to the risk by including the response to take, as shown in Table 4.