Transcription of IGHT SIZING LABORATORY EQUIPMENT LOADS
1 LABORATORIES FOR THE 21 ST CENTURY : BEST PRACTICE GUID E RIGHT- SIZING LABORATORY EQUIPMENT LOADS Introduction LABORATORY EQUIPMENT such as autoclaves, glass washers, refrigerators, and computers account for a sig-nificant portion of the energy use in laboratories. However, because of the general lack of measured equip-ment load data for laboratories, designers often use esti-mates based on nameplate rated data, or design assumptions from prior projects. Consequently, peak EQUIPMENT LOADS are frequently overestimated. This results in oversized HVAC systems, increased initial con-struction costs, and increased energy use due to inefficien-cies at low part- load operation. This best-practice guide first presents the problem of over- SIZING in typical prac-tice, and then describes how best-practice strategies obtain better estimates of EQUIPMENT LOADS and right-size HVAC systems, saving initial construction costs as well as life-cycle energy costs. This guide is one in a series created by the Laboratories for the 21st Century ( Labs21 ) program, a joint program of the Environmental Protection Agency and Department of Energy.
2 Geared towards architects, engineers, and facilities managers, these guides provide information about technologies and practices to use in designing, constructing, and operating safe, sus-tainable, high-performance laboratories. EQUIPMENT load Estimation Typical Practice HVAC systems are sized based on a peak condition that takes into account climate-related LOADS and internal LOADS from occupants, lighting, and EQUIPMENT . For some of these parameters, there are well-established criteria for peak conditions ( , design days for climate), while for others, the designer has to use context-specific informa-tion ( , load diversity) and engineering judgment to determine a peak load . This is especially the case with EQUIPMENT LOADS , for which there is uncertainty about several factors: Quantity and type of EQUIPMENT : While this is ana-lyzed and documented by LABORATORY planners during the programming phase of design, the actual quantity and type of EQUIPMENT installed will vary over the life cycle of the LABORATORY .
3 Rated vs. actual power: For most EQUIPMENT , the rated ( nameplate ) power is much higher than the actual power, even when the EQUIPMENT is in full operating mode. Schedule of use: Even if the designer has good esti-mates of the first two parameters, the schedule of use is very difficult to derive deterministically, because it Department of Energy Energy Efficiency and Renewable Energy Federal Energy Management Program LABSFORTHE21 STCENTURY3 2 LABS FOR THE 21ST CENTURY is largely driven by user behavior, and the complete inventory of installed EQUIPMENT is typically not used simultaneously. The ASHRAE HVAC Applications Handbook 1999 [ASHRAE 1999, p. ] recommends that the designer ..should evaluate EQUIPMENT nameplate ratings, appli-cable use and usage factors, and overall diversity. However, due to the lack of data on these parameters, it is often difficult to analytically derive the EQUIPMENT As a result, designers typically assume the worst case for each of these parameters, thereby grossly overestimating actual EQUIPMENT LOADS [Wilkins 1998, Wilkins and Hosni 2000 cited in Brown 2002].
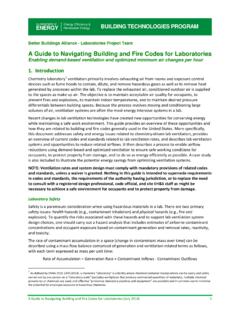
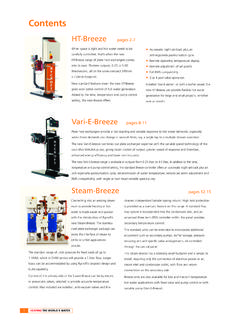
4 Furthermore, designers assume that the worst-case EQUIPMENT load will be simultaneous with the worst-case climate LOADS . In short, conventional engineering methods chronically over-size HVAC sys-tems. Brown [2002] cites several examples, including one in which, even after the size of the cooling plant was halved, the as-installed plant still had twice the capacity needed to meet the actual LOADS of the fully occupied building. An analysis of 26 LABORATORY projects by Martin [2004] showed that the over- SIZING of cooling systems in these projects ranged from 40% to 300%, with an average of about 80%. Data from the Labs21 benchmarking database pro-vides further insight [Mathew et al. 2004]. The database contains data on energy use and demand for about 70 lab-oratory facilities. Figure 1 shows the total electrical demand for the facilities for which measured peak demand data were available. The facilities include various types of laboratories in several different climate zones.
5 The data show that none of the facilities have total peak electrical LOADS of more than 15 W/gsf. Note that this met-ric includes all electric end uses, , HVAC, lighting, and EQUIPMENT . Yet, it is common for designers to assume EQUIPMENT LOADS alone at 10-12 W/sf or more. While this assumption may be appropriate for a few high-intensity lab spaces in a building, it would be unreasonable to assume such high LOADS building-wide. Case Study: Measured vs. Estimated LOADS The University of California, Davis (UC Davis) initiat-ed a project to measure EQUIPMENT LOADS at two of its labo-ratory buildings in order to use the measured data as a basis for SIZING the HVAC systems in the design of new, comparable facilities. In each building, measurements were made for several LABORATORY spaces, representing a range of different uses within that building. Clamp-on meters were used to take continuous measurements of EQUIPMENT electrical LOADS for each lab space. Each mea-surement period was typically about two weeks long.
6 The measurements were taken when the labs were nominally fully occupied and used. Three quantities were measured, as follows: Apparent instantaneous power: The product of the voltage and the current at any given instant. This num-ber is important because it informs the SIZING of the electrical distribution system. Actual instantaneous power: This is the actual instan-taneous power draw, which becomes a thermal load to the space. Average interval power: This is obtained by averaging the actual instantaneous power over each 15-minute Figure 1. Total electrical demand (W/gsf) for various LABORATORY facilities recorded in the Labs21 energy benchmarking database. 1 ASHRAE indicates that heat gains in laboratories range from 5 W/sf to 25 W/sf, but there are no additional data that would narrow this range for use in the design of a specific LABORATORY .
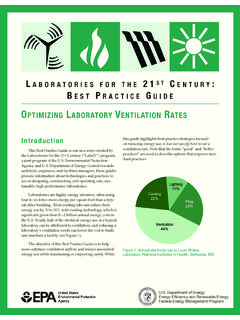
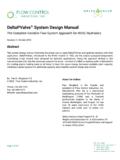
7 LABS FOR THE 21ST CENTURY2 3 LABS FOR THE 21ST CENTURY interval. This quantity is typically measured by utility interval meters to determine demand charges. Figure 2 shows the 15-minute-interval measured data for two LABORATORY spaces, each of which was measured twice (about four weeks total for each space). The figure shows the peak apparent instantaneous power (in VA/sf), peak actual instantaneous power (in W/sf) and the aver-age interval power for each 15-minute interval (also in W/sf). As expected, in each interval the peak apparent power is always equal to or higher than the peak actual power,2 which in turn is always higher than the average interval power. In space A, the overall peak apparent power is about 8 VA/sf, and the overall peak actual power is about W/sf. The maximum interval power is only about W/sf, which is less than half the overall peak apparent power. In space B, the overall peak apparent power is about 40 VA/sf, and the overall peak actual power is about 29 W/sf, while the maximum interval power is about 6 W/sf, which is only 15% of the overall peak apparent power.
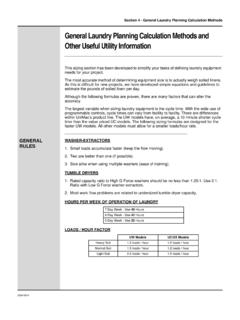
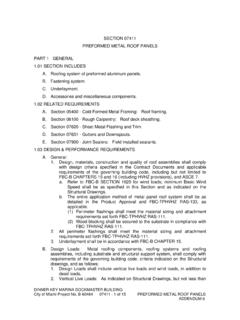
8 Generally, space temperatures are not sensitive to instantaneous peaks of a few seconds, and, therefore, it is unnecessary to size HVAC systems to peak instantaneous power. (The only exception to this would be in highly spe-cialized labs with EQUIPMENT , processes, or instrument cali-bration requirements that require space temperatures to be very tightly controlled.) In most situations, it is more appropriate to size HVAC systems to the maximum inter-val power. Yet, it is not uncommon for designers to assume EQUIPMENT LOADS that even exceed the peak instantaneous power. Figure 3 compares the measured LOADS to the assumed design LOADS for several different LABORATORY spaces in one of the buildings at UC Davis. This shows that the design assumptions were 2 to 5 times the peak instan-taneous power, and were a whole order of magnitude above the maximum interval power. Evidence from labo-ratory designers and planners suggests this is not unusual and occurs widely in LABORATORY design practice.
9 3 Best Practice Strategies 1. Measure EQUIPMENT LOADS in a comparable lab. The Labs21 Environmental Performance Criteria [Labs21 2005] has a credit for right- SIZING that recom-mends the following approach: ..For each comparable LABORATORY space, obtain one week (7 days) of continuous power metering at a distribution panel level of all LABORATORY EQUIPMENT , including plug LOADS and hard-wired data should be obtained while the spaces are fully occupied. Continuous metering data should be time averaged over 15 minute time periods. Design heat load criteria for each typical LABORATORY space in the facility should then be based on the maximum load indicated over the metering It should be noted that this approach represents a min-imum requirement, and longer or more detailed measure-ments may be required for specialized situations. Figure 2. 15-minute-interval measurements of EQUIPMENT LOADS for two LABORATORY spaces in the UC Davis building.
10 Each graph shows peak apparent instantaneous power (Max VA/sf), peak actual instantaneous power (Max W/sf), and average power (Avg w/sf) in each interval. 2 The ratio of actual power to apparent power is the power factor, which is always less than or equal to 1. 3 It is important to note that the SIZING approach for electrical systems is different from HVAC systems. The electrical designer is more constrained by the National Electrical Code, and other code and safety constraints. HVAC designers have much greater latitude in their approach to SIZING . HVAC constraints are largely self-imposed, consisting primarily of the code of common sense and the risk of liability. LABSFORTHE21 STCENTURY5 4 LABS FOR THE 21ST CENTURY Design LOADS vs. Measured Power -10 20 30 40 50 60 70 3L2A 3L2B 3L2C 3L2D 3L2E 3L2H 3L2L Design load Max Apparent Power Max Interval Power W/sf Figure 3. Comparison of EQUIPMENT power used for design, measured peak apparent (instantaneous) power, and maximum interval power for various LABORATORY spaces at UC Davis.