Transcription of ILQGLQJV - itu.int
1 Key findingsChapter 1. The ICT Development Index (IDI) Global Analysis3 Measuring the Information Society Report 2016 Key findingsThe ITU ICT Development Index (IDI) is a unique benchmark of the level of ICT development in countries across the world. The IDI combines eleven indicators on ICT access, use and skills, capturing key aspects of ICT development in one measure that allows for comparisons across countries and over time. The IDI 2016, which covers 175 economies worldwide and makes comparisons to IDI 2015, highlights both progress and persistent divides in the global information all countries improved their IDI values over the last year, but great disparities continue to exist between more and less connected countries. The average IDI value rose by points to points (out of 10), with smaller increases at the top and at the bottom of the list.
2 The gap between the highest and lowest performing countries one measure of the digital divide remained almost unchanged, at points in IDI 2016. The Republic of Korea tops the IDI rankings in 2016 for the second consecutive year. The top 10 countries also include two other economies in the Asia-Pacific region, and seven European countries. This reflects the high level of ICT investment and innovation occurring in developed and high-income developing economies. The majority of high-performing countries have liberalized and competitive ICT markets that encourage innovation. They also have populations with relatively high incomes and the skills needed to make effective use of is a strong association between economic and ICT development, with least developed countries at a particular disadvantage. The average IDI value for developed countries ( ) is points higher than that for developing countries ( ), although developing countries improved their IDI value more than developed countries.
3 There is also a strong association between least connected countries, countries that are in the bottom quartile of the IDI 2016 distribution, and least developed countries. Indeed, the bottom 27 countries are all least developed countries, and the gap in IDI values between these countries and higher-performing developing countries continues to has been greater improvement in ICT use than access. The use sub-index rose by an average points, compared with an increase of points in the access sub-index, making ICT use a greater factor of change in IDI outcomes between 2015 and 2016. The increase in the IDI use sub-index was mainly a result of strong growth in mobile-broadband subscriptions across the world. In most regions, the increase in ICT access mainly related to progress made in connecting more households to the Internet, while in Africa improvements in mobile-cellular penetration had a greater impact on the value of the IDI access sub-index.
4 Countries from around the world showed strong improvements in performance. The greatest improvement was achieved by St. Kitts and Nevis, which rose from 54th place in 2015 to 34th place in 2016. Other countries showing substantial ICT progress include Myanmar, Algeria and Bhutan. The experiences in investment, policy and regulation of top-ranking and dynamic economies discussed in further detail in this chapter are a source of valuable insights for governments and businesses worldwide. Chapter 2. The ICT Development Index (IDI) regional and country analysisMeasuring the Information Society Report 2016 5 Key findingsThere is a strong association between national and regional levels of ICT development, as captured by the ICT Development Index (IDI), and the level of social and economic development. While the overall regional IDI values did not shift dramatically compared to 2015, some countries made significant progress as a result of infrastructure investment and changes in policy and continues to lead the way in ICT development.
5 It had the highest average IDI value among world regions ( points). Albania is the only country in Europe falling slightly below the global average. This reflects the region s high levels of economic development and ICT investment. Countries in Europe generally have liberalized communication markets with high levels of ICT access, use and number of countries in the Americas significantly improved their performance in the IDI. Three island countries in the Caribbean St. Kitts and Nevis, Dominica and Grenada featured among the most dynamic countries, with strong improvements in their IDI value and rank. Several countries in Latin America, notably Bolivia and Mexico, also made noticeable progress in their IDI performance. Similar to other regions, the growth of mobile-broadband subscriptions played a particularly strong part in these Commonwealth of Independent States (CIS) is the most homogeneous region in terms of ICT development.
6 Nearly all countries in the CIS have IDI values above the global average, and all countries in the region improved their IDI values as a result of increases in mobile-cellular and mobile-broadband Asia and the Pacific region is, by contrast, the most heterogeneous. The region's top seven economies have IDI values above points and rank within the highest quartile of IDI 2016. The region also includes a number of countries that significantly increased their IDI value and rank over the year, including Bhutan, Myanmar and Malaysia. However, nine out of 34 countries in the region, including several with large populations, are least connected countries (LCCs).There is great diversity in ICT development across the Arab States. The five highest performing countries in the Arab States region are oil-rich high-income economies, but the region also includes a number of low-income countries, three of which are LCCs.
7 This illustrates that the digital divide between the LCCs and the more prosperous countries in the region may be is the region with the lowest IDI performance. The average IDI 2016 value for the Africa region was points, just over half the global average of The majority of the 39 African countries in IDI 2016 are LCCs. This reflects the lower level of economic development in the region, which inhibits ICT development. The highest growth achieved was in the number of mobile-cellular subscriptions, in contrast to other regions, in which the number of mobile-broadband subscriptions experienced the highest growth. Investment, policy and regulation influence the performance of individual countries. A number of countries rank higher than expected on the IDI relative to their level of economic development. In most regions, a number of countries also significantly increased their IDI rankings in only one year.
8 The experiences of these dynamic countries, several of which are illustrated in this chapter, are a source of insights for other governments and businesses within their regions. Chapter 3. The role of ICTs in monitoring the SDGsMeasuring the Information Society Report 2016 7 Key findingsIn 2015, the United Nations identified 17 Sustainable Development Goals (SDGs) and associatedtargets, which will guide international development between 2015 and 2030. To measureprogress towards achievement of the SDGs, the United Nations Statistical Commission adopteda global framework of indicators. Several SDGs refer to ICTs and technology, and several ICTindicators were identified to help track SDGs 4, 5, 9 and access to computers and the Internet in schools. SDG 4 is concerned with inclusive and equitable educational opportunities for all.
9 One of its targets is to ensure provisionof appropriate and inclusive educational facilities. Available data on schools with access tocomputers and the Internet suggest that, while a number of developing countries haveachieved 100 per cent access to computers in both primary and secondary schools, manyother countries lag ICT skills among youth and adults. Another SDG 4 target is to enhance the skills needed for employment, decent jobs and entrepreneurship. This will be measured by theproportion of young people and adults with a range of ICT skills. Data show that the share of thepopulation with specific ICT skills is considerably higher in developed countries than it is in developing the role of ICTs in women s empowerment. SDG 5 is concerned with women sempowerment. One of its targets is to enhance the use of ICTs to promote empowerment.
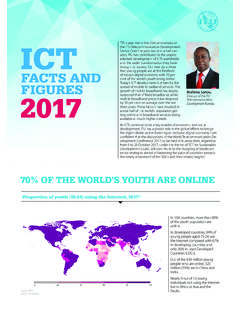
10 Data on the percentage of women and men who own a mobile phone show that the gender gap inmobile phone ownership and use is higher in lower-income and less connected countries. Monitoring the growth of access to ICTs and the Internet. SDG 9 calls for increased accessto ICTs, working towards "universal and affordable access to the Internet in least developedcountries by 2020". One of its targets focuses on the need to increase access to ICTs andthe Internet, as measured by the percentage of the population covered by different mobiletechnologies. The proportion of the population covered by a mobile-broadband network will reach 84 per cent in 2016 globally, but only 67 per cent in rural areas. Just over half of the global population is covered by LTE or higher networks and few of those living in rural areas. Monitoring the contribution of ICTs to science, technology and innovation.